UNITED STATES
SECURITIES AND EXCHANGE COMMISSION
WASHINGTON, D.C. 20549
SCHEDULE 13E-3
RULE 13e-3 TRANSACTION STATEMENT UNDER SECTION 13(e)
OF THE SECURITIES EXCHANGE ACT OF 1934
DCP MIDSTREAM, LP
(Name of the Issuer)
DCP Midstream, LP
DCP Midstream GP, LP
DCP Midstream GP, LLC
DCP Midstream, LLC
Phillips Gas Company LLC
Phillips 66 Project Development Inc.
Dynamo Merger Sub LLC
Phillips 66
(Name of Persons Filing Statement)
COMMON UNITS
REPRESENTING LIMITED PARTNER INTERESTS
(Title of Class of Securities)
23311P100
(CUSIP Number of Class of Securities)
Vanessa Allen Sutherland
2331 CityWest Blvd.
Houston, Texas 77042
Telephone: (832) 765-3010
(Name, Address, and Telephone Numbers of Person Authorized to Receive Notices and Communications on Behalf of the Persons Filing Statement)
With copies to:
| William S. Anderson Bracewell LLP 711 Louisiana Street, Suite 2300 Houston, Texas 77002 Telephone: (713) 221-1122 |
G. Michael O’Leary Hunton Andrews Kurth LLP 600 Travis Street, Suite 4200 Houston, Texas 77002 Telephone: (713) 220-4360 |
Srinivas M. Raju Richards, Layton & Finger, P.A. 920 N. King Street Wilmington, Delaware 19801 Telephone: (302) 651-7748 |
This statement is filed in connection with (check the appropriate box):
| a. |
☒ | The filing of solicitation materials or an information statement subject to Regulation 14A (§§240.14a-1 through 240.14b-2), Regulation 14C (§§240.14c-1 through 240.14c-101) or Rule 13e-3(c) (§240.13e-3(c)) under the Securities Exchange Act of 1934. | ||
| b. |
☐ | The filing of a registration statement under the Securities Act of 1933. | ||
| c. |
☐ | A tender offer. | ||
| d. |
☐ | None of the above. | ||
Check the following box if the soliciting materials or information statement referred to in checking box (a) are preliminary copies: ☒
Check the following box if the filing is a final amendment reporting the results of the transaction: ☐
INTRODUCTION
This Rule 13e-3 Transaction Statement on Schedule 13E-3 (this “Transaction Statement”), together with the exhibits hereto, is being filed with the Securities and Exchange Commission (the “SEC”) pursuant to Section 13(e) of the Securities Exchange Act of 1934, as amended (the “Exchange Act”), by (i) DCP Midstream, LP, a Delaware limited partnership (the “Partnership”), (ii) DCP Midstream GP, LP, a Delaware limited partnership and the general partner of the Partnership (the “General Partner”), (iii) DCP Midstream GP, LLC, a Delaware limited liability company and the general partner of the General Partner (“DCP GP LLC”), (iv) DCP Midstream, LLC, a Delaware limited liability company (“DCP Midstream”), (v) Phillips Gas Company LLC, a Delaware limited liability company and the Class A Managing Member of DCP Midstream (“PGC”), (vi) Phillips 66 Project Development Inc., a Delaware corporation and indirect wholly owned subsidiary of Phillips 66 (“PDI”), (vii) Dynamo Merger Sub LLC, a Delaware limited liability company and wholly owned subsidiary of PDI (“Merger Sub”), and (viii) Phillips 66, a Delaware corporation (“Phillips 66”). Collectively, the persons filing this Transaction Statement are referred to as the “filing persons.”
This Transaction Statement relates to the Agreement and Plan of Merger, dated as of January 5, 2023, by and among Phillips 66, PDI, Merger Sub, the Partnership, the General Partner and DCP GP LLC (the “Merger Agreement”). Pursuant to the Merger Agreement, Merger Sub will merge with and into the Partnership, with the Partnership surviving as a Delaware limited partnership (the “Merger”). Under the terms of the Merger Agreement, at the effective time of the Merger (the “Effective Time”), each common unit representing a limited partner interest in the Partnership (each, a “Common Unit”) issued and outstanding as of immediately prior to the Effective Time (other than the Sponsor Owned Units, as defined below) (each, a “Public Common Unit”) will be converted into the right to receive $41.75 per Public Common Unit in cash, without interest. The Partnership’s Series B Preferred Units and Series C Preferred Units will be unaffected by the Merger and will remain issued and outstanding immediately following the Merger. The Common Units owned by DCP Midstream and the General Partner (collectively, the “Sponsor Owned Units”) will be unaffected by the Merger and will remain issued and outstanding immediately following the Merger. Under the terms of the Merger Agreement, at the Effective Time, PDI’s ownership interest in Merger Sub will be converted into a number of new Common Units equal to the number of Public Common Units.
On January 5, 2023, the Special Committee (the “Special Committee”) of the Board of Directors of DCP GP LLC (the “GP Board”), consisting entirely of individuals that satisfy the independence and other requirements for service on the Special Committee that are set forth in the Partnership’s Fifth Amended and Restated Agreement of Limited Partnership (the “Partnership Agreement”), by unanimous vote, (i) determined that the proposed Merger, on the terms and conditions set forth in the Merger Agreement, is in the best interests of the Partnership and the holders of Common Units other than DCP Midstream, the General Partner, Phillips 66 and each of their respective affiliates (the “Public Unitholders”) and the consideration to be paid to the Public Unitholders is fair to the Public Unitholders, (ii) approved the Merger Agreement and the transactions contemplated thereby, including the Merger, with such approval constituting “Special Approval” for all purposes of the Partnership Agreement, including Section 7.9(a) thereof, DCP GP LLC’s Amended and Restated Limited Liability Company Agreement, including Section 6.09(a) thereof, and the General Partner’s Amended and Restated Agreement of Limited Partnership, including Section 7.9(a) thereof, (iii) recommended that the GP Board approve the Merger Agreement and the transactions contemplated thereby, including the Merger, and the execution, delivery and performance of the Merger Agreement and the transactions contemplated thereby, including the Merger, and (iv) recommended that the GP Board resolve to direct that the Merger Agreement and the approval of the Merger be submitted to a vote of the holders of Common Units.
Following the receipt of the Special Committee’s determination and approvals and its related recommendations, at a meeting held on January 5, 2023, the GP Board (acting, in part, based upon the receipt of the Special Committee’s determination and approvals and its related recommendations), by unanimous vote, (i) determined that the Merger Agreement and the transactions contemplated thereby, including the Merger, are in the best interests of the Partnership and the Public Unitholders, (ii) authorized and approved the execution and delivery of the Merger Agreement and the consummation of the transactions contemplated thereby, including the Merger, on the terms and subject to the conditions set forth in the Merger Agreement, (iii) directed that the approval of the Merger Agreement and the approval of the Merger be submitted to a vote of the holders of Common Units pursuant to Section 14.3 of the Partnership Agreement and (iv) authorized the holders of Common Units to act by written consent pursuant to Section 13.11 of the Partnership Agreement.
Pursuant to the Partnership Agreement, the approval of the Merger Agreement and the Merger by the Partnership’s limited partners requires the affirmative vote or written consent of a majority of the outstanding Common Units. On January 5, 2023, concurrently with the execution and delivery of the Merger Agreement, DCP Midstream and the General Partner, which together owned 56.5% of the Common Units issued and outstanding as of such date, delivered a written consent to the General Partner approving the Merger Agreement and the transactions contemplated thereby, including the Merger.
Completion of the Merger is subject to satisfaction or waiver of certain customary conditions.
Concurrently with the filing of this Transaction Statement, the Partnership is filing a preliminary information statement on Schedule 14C (the “Information Statement”). A copy of the Information Statement is attached hereto as Exhibit (a)(1) and a copy of the Merger Agreement is attached as Annex A to the Information Statement. All references in this Transaction Statement to Items numbered 1001 to 1016 are references to Items contained in Regulation M-A under the Exchange Act.
Pursuant to General Instruction F to Schedule 13E-3, the information contained in the Information Statement, including all annexes thereto, is expressly incorporated herein by reference in its entirety, and responses to each item herein are qualified in their entirety by the information contained in the Information Statement and the annexes thereto. The cross-references below are being supplied pursuant to General Instruction G to Schedule 13E-3 and show the location in the Information Statement of the information required to be included in response to the items of Schedule 13E-3. As of the date hereof, the Information Statement is in preliminary form and is subject to completion. Terms used but not defined in this Transaction Statement shall have the meanings given to them in the Information Statement.
All information concerning the Partnership contained in, or incorporated by reference into, this Transaction Statement was supplied by the Partnership. Similarly, all information concerning each other filing person contained in, or incorporated by reference into, this Transaction Statement was supplied by such filing person.
ITEM 1. SUMMARY TERM SHEET
Regulation M-A, Item 1001
The information set forth in the Information Statement under the following captions is incorporated herein by reference:
“Summary Term Sheet”
“Questions and Answers”
ITEM 2. SUBJECT COMPANY INFORMATION
Regulation M-A, Item 1002
| (a) | Name and Address. |
The information set forth in the Information Statement under the following captions is incorporated herein by reference:
“Summary Term Sheet—Parties to the Merger”
“Information Concerning the Partnership”
| (b) | Securities. |
The information set forth in the Information Statement under the following captions is incorporated herein by reference:
“Summary Term Sheet—Parties to the Merger”
“Information Concerning the Partnership”
| (c) | Trading Market and Price. |
The information set forth in the Information Statement under the following caption is incorporated herein by reference:
“Common Unit Market Price and Distribution Information—Common Unit Market Price Information”
| (d) | Dividends. |
The information set forth in the Information Statement under the following caption is incorporated herein by reference:
“Common Unit Market Price and Distribution Information—Distribution Information”
| (e) | Prior Public Offerings. |
Not applicable.
| (f) | Prior Stock Purchases. |
Not applicable.
ITEM 3. IDENTITY AND BACKGROUND OF FILING PERSON
Regulation M-A, Item 1003
| (a) | Name and Address. |
The information set forth in the Information Statement under the following captions is incorporated herein by reference:
“Summary Term Sheet—Parties to the Merger”
“Information Concerning the Partnership”
“Information Concerning the Phillips 66 Filing Parties”
| (b) | Business and Background of Entities. |
The information set forth in the Information Statement under the following captions is incorporated herein by reference:
“Summary Term Sheet—Parties to the Merger”
“Information Concerning the Partnership”
“Information Concerning the Phillips 66 Filing Parties”
| (c) | Business and Background of Natural Persons. |
The information set forth in the Information Statement under the following caption is incorporated herein by reference:
“Business and Background of Natural Persons”
ITEM 4. TERMS OF THE TRANSACTION
Regulation M-A, Item 1004
| (a) | Material Terms. |
The information set forth in the Information Statement under the following captions is incorporated herein by reference:
“Summary Term Sheet”
“Questions and Answers”
“Special Factors—Background of the Merger”
“Special Factors—Reasons for Approval of the Merger Agreement by the Special Committee and the GP Board”
“Special Factors—Position of the Phillips 66 Filing Parties as to the Fairness of the Merger”
“Special Factors—Purposes and Reasons of the Phillips 66 Filing Parties for the Merger”
“Special Factors—Effects of the Merger”
“Special Factors—Primary Benefits and Detriments of the Merger”
“Special Factors—Interests of the Directors and Executive Officers of DCP GP LLC in the Merger”
“Special Factors—Material U.S. Federal Income Tax Consequences of the Merger”
“Special Factors—Ownership of the Partnership After the Merger”
“Special Factors—Financing of the Merger”
“Special Factors—Provisions for Public Unitholders”
“Special Factors—Delisting and Deregistration”
“Special Factors—No Dissenters’ or Appraisal Rights”
“Special Factors—Accounting Treatment of the Merger”
“The Merger Agreement”
“Material U.S. Federal Income Tax Consequences of the Merger”
“Unit Ownership of Certain Beneficial Owners, Directors and Executive Officers”
“Delisting and Deregistration of Common Units”
“Annex A: Agreement and Plan of Merger”
| (b) | Purchases. |
Not required by Schedule 13E-3.
| (c) | Different Terms. |
The information set forth in the Information Statement under the following captions is incorporated herein by reference:
“Summary Term Sheet”
“Questions and Answers”
“Special Factors—Effects of the Merger”
“Special Factors—Primary Benefits and Detriments of the Merger”
“Special Factors—Interests of the Directors and Executive Officers of DCP GP LLC in the Merger”
“Special Factors—No Dissenters’ or Appraisal Rights”
“The Merger Agreement”
“Annex A: Agreement and Plan of Merger”
| (d) | Appraisal Rights. |
The information set forth in the Information Statement under the following captions is incorporated herein by reference:
“Summary Term Sheet—No Dissenters’ or Appraisal Rights”
“Questions and Answers”
“Special Factors—No Dissenters’ or Appraisal Rights”
| (e) | Provisions for Unaffiliated Security Holders. |
The information set forth in the Information Statement under the following captions is incorporated herein by reference:
“Summary Term Sheet—Provisions for Public Unitholders”
“Special Factors—Provisions for Public Unitholders”
| (f) | Eligibility for Listing or Trading. |
Not applicable.
| ITEM 5 | . PAST CONTACTS, TRANSACTIONS, NEGOTIATIONS AND AGREEMENTS |
Regulation M-A, Item 1005
| (a) | Transactions. |
The information set forth in the Information Statement under the following captions is incorporated herein by reference:
“Summary Term Sheet”
“Questions and Answers”
“Special Factors—Background of the Merger”
“Special Factors—Interests of the Directors and Executive Officers of DCP GP LLC in the Merger”
“Information Concerning the Phillips 66 Filing Parties”
“Unit Ownership of Certain Beneficial Owners, Directors and Executive Officers”
“Past Contacts, Transactions, Negotiations and Agreements”
“Certain Purchases and Sales of Common Units”
“Where You Can Find More Information”
| (b) | Significant Corporate Events. |
The information set forth in the Information Statement under the following captions is incorporated herein by reference:
“Summary Term Sheet”
“Special Factors—Background of the Merger”
“Special Factors—Reasons for Approval of the Merger Agreement by the Special Committee and the GP Board”
“Special Factors—Position of the Phillips 66 Filing Parties as to the Fairness of the Merger”
“Special Factors—Purposes and Reasons of the Phillips 66 Filing Parties for the Merger”
“Special Factors—Effects of the Merger”
“Special Factors—Interests of the Directors and Executive Officers of DCP GP LLC in the Merger”
“The Merger Agreement”
“Information Concerning the Phillips 66 Filing Parties”
“Past Contacts, Transactions, Negotiations and Agreements”
“Certain Purchases and Sales of Common Units”
“Where You Can Find More Information”
“Annex A: Agreement and Plan of Merger”
| (c) | Negotiations or Contacts. |
The information set forth in the Information Statement under the following captions is incorporated herein by reference:
“Summary Term Sheet”
“Special Factors—Background of the Merger”
“Special Factors—Reasons for Approval of the Merger Agreement by the Special Committee and the GP Board”
“Special Factors—Position of the Phillips 66 Filing Parties as to the Fairness of the Merger”
“Special Factors—Purposes and Reasons of the Phillips 66 Filing Parties for the Merger”
“Special Factors—Effects of the Merger”
“Special Factors—Interests of the Directors and Executive Officers of DCP GP LLC in the Merger”
“The Merger Agreement”
“Information Concerning the Phillips 66 Filing Parties”
“Past Contacts, Transactions, Negotiations and Agreements”
“Certain Purchases and Sales of Common Units”
“Where You Can Find More Information”
“Annex A: Agreement and Plan of Merger”
| (d) | Conflicts of Interest. |
Not required by Schedule 13E-3.
| (e) | Agreements Involving the Subject Company’s Securities. |
The information set forth in the Information Statement under the following captions is incorporated herein by reference:
“Summary Term Sheet”
“Special Factors—Background of the Merger”
“Special Factors—Interests of the Directors and Executive Officers of DCP GP LLC in the Merger”
“The Merger Agreement”
“Unit Ownership of Certain Beneficial Owners, Directors and Executive Officers”
“Past Contacts, Transactions, Negotiations and Agreements”
“Certain Purchases and Sales of Common Units”
“Where You Can Find More Information”
“Annex A: Agreement and Plan of Merger”
| ITEM 6 | . PURPOSES OF THE TRANSACTION AND PLANS OR PROPOSALS |
Regulation M-A, Item 1006
| (a) | Purposes. |
Not required by Schedule 13E-3.
| (b) | Use of Securities Acquired. |
The information set forth in the Information Statement under the following captions is incorporated herein by reference:
“Summary Term Sheet”
“Questions and Answers”
“Special Factors—Effects of the Merger”
“Special Factors—Primary Benefits and Detriments of the Merger”
“Special Factors—Interests of the Directors and Executive Officers of DCP GP LLC in the Merger”
“The Merger Agreement”
“Delisting and Deregistration of Common Units”
“Annex A: Agreement and Plan of Merger”
| (c) | (1)-(8) Plans. |
The information set forth in the Information Statement under the following captions is incorporated herein by reference:
“Summary Term Sheet”
“Questions and Answers”
“Special Factors—Background of the Merger”
“Special Factors—Reasons for Approval of the Merger Agreement by the Special Committee and the GP Board”
“Special Factors—Purposes and Reasons of the Phillips 66 Filing Parties for the Merger”
“Special Factors—Effects of the Merger”
“Special Factors—Primary Benefits and Detriments of the Merger”
“Special Factors—Financing of the Merger”
“Special Factors—Delisting and Deregistration”
“The Merger Agreement”
“Common Unit Market Price and Distribution Information”
“Unit Ownership of Certain Beneficial Owners, Directors and Executive Officers”
“Delisting and Deregistration of Common Units”
“Annex A: Agreement and Plan of Merger”
| (d) | Subject Company Negotiations. |
Not required by Schedule 13E-3.
| ITEM 7 | . PURPOSES, ALTERNATIVES, REASONS AND EFFECTS |
Regulation M-A, Item 1013
| (a) | Purposes. |
The information set forth in the Information Statement under the following captions is incorporated herein by reference:
“Summary Term Sheet”
“Questions and Answers”
“Special Factors—Background of the Merger”
“Special Factors—Reasons for Approval of the Merger Agreement by the Special Committee and the GP Board”
“Special Factors—Position of the Phillips 66 Filing Parties as to the Fairness of the Merger”
“Special Factors—Purposes and Reasons of the Phillips 66 Filing Parties for the Merger”
“Special Factors—Effects of the Merger”
“Special Factors—Primary Benefits and Detriments of the Merger”
“Special Factors—Interests of the Directors and Executive Officers of DCP GP LLC in the Merger”
“Special Factors—Ownership of the Partnership After the Merger”
| (b) | Alternatives. |
The information set forth in the Information Statement under the following captions is incorporated herein by reference:
“Special Factors—Background of the Merger”
“Special Factors—Reasons for Approval of the Merger Agreement by the Special Committee and the GP Board”
“Special Factors—Position of the Phillips 66 Filing Parties as to the Fairness of the Merger”
“Special Factors—Purposes and Reasons of the Phillips 66 Filing Parties for the Merger”
“Special Factors—Primary Benefits and Detriments of the Merger”
| (c) | Reasons. |
The information set forth in the Information Statement under the following captions is incorporated herein by reference:
“Summary Term Sheet”
“Questions and Answers”
“Special Factors—Background of the Merger”
“Special Factors—Reasons for Approval of the Merger Agreement by the Special Committee and the GP Board”
“Special Factors—Position of the Philips 66 Filing Parties as to the Fairness of the Merger”
“Special Factors—Purposes and Reasons of the Phillips 66 Filing Parties for the Merger”
“Special Factors—Effects of the Merger”
“Special Factors—Primary Benefits and Detriments of the Merger”
“Special Factors—Interests of the Directors and Executive Officers of DCP GP LLC in the Merger”
“Special Factors—Ownership of the Partnership After the Merger”
| (d) | Effects. |
The information set forth in the Information Statement under the following captions is incorporated herein by reference:
“Summary Term Sheet”
“Questions and Answers”
“Special Factors—Background of the Merger”
“Special Factors—Reasons for Approval of the Merger Agreement by the Special Committee and the GP Board”
“Special Factors—Purposes and Reasons of the Phillips 66 Filing Parties for the Merger”
“Special Factors—Effects of the Merger”
“Special Factors—Primary Benefits and Detriments of the Merger”
“Special Factors—Interests of the Directors and Executive Officers of DCP GP LLC in the Merger”
“Special Factors—Material U.S. Federal Income Tax Consequences of the Merger”
“The Merger Agreement”
“Material U.S. Federal Income Tax Consequences of the Merger”
“Delisting and Deregistration of Common Units”
“Annex A: Agreement and Plan of Merger”
| ITEM 8 | . FAIRNESS OF THE TRANSACTION |
Regulation M-A, Item 1014
| (a) | Fairness. |
The information set forth in the Information Statement under the following captions is incorporated herein by reference:
“Summary Term Sheet”
“Questions and Answers”
“Special Factors—Background of the Merger”
“Special Factors—Resolution of Conflicts of Interest; Standards of Conduct and Modification of Duties”
“Special Factors—Reasons for Approval of the Merger Agreement by the Special Committee and the GP Board”
“Special Factors—Opinion of Evercore – Financial Advisor to the Special Committee”
“Special Factors—Position of the Phillips 66 Filing Parties as to the Fairness of the Merger”
“Special Factors—Purposes and Reasons of the Phillips 66 Filing Parties for the Merger”
“Special Factors—Effects of the Merger”
“Special Factors—Primary Benefits and Detriments of the Merger”
“Special Factors—Interests of the Directors and Executive Officers of DCP GP LLC in the Merger”
“The Merger Agreement”
“Common Unit Market Price and Distribution Information”
“Annex A: Agreement and Plan of Merger”
“Annex B: Opinion of Evercore Group L.L.C.”
| (b) | Factors Considered in Determining Fairness. |
The information set forth in the Information Statement under the following captions is incorporated herein by reference:
“Summary Term Sheet”
“Questions and Answers”
“Special Factors—Background of the Merger”
“Special Factors—Resolution of Conflicts of Interest; Standards of Conduct and Modification of Duties”
“Special Factors—Reasons for Approval of the Merger Agreement by the Special Committee and the GP Board”
“Special Factors—Opinion of Evercore – Financial Advisor to the Special Committee”
“Special Factors—Position of the Phillips 66 Filing Parties as to the Fairness of the Merger”
“Special Factors—Purposes and Reasons of the Phillips 66 Filing Parties for the Merger”
“Special Factors—Effects of the Merger”
“Special Factors—Primary Benefits and Detriments of the Merger”
“Special Factors—Interests of the Directors and Executive Officers of DCP GP LLC in the Merger”
“The Merger Agreement”
“Common Unit Market Price and Distribution Information”
“Annex A: Agreement and Plan of Merger”
“Annex B: Opinion of Evercore Group L.L.C.”
| (c) | Approval of Security Holders. |
The information set forth in the Information Statement under the following captions is incorporated herein by reference:
“Summary Term Sheet”
“Questions and Answers”
“Special Factors—Reasons for Approval of the Merger Agreement by the Special Committee and the GP Board”
“Special Factors—Purposes and Reasons of the Phillips 66 Filing Parties for the Merger”
“Special Factors—Primary Benefits and Detriments of the Merger”
“The Merger Agreement”
“Annex A: Agreement and Plan of Merger”
| (d) | Unaffiliated Representative. |
The information set forth in the Information Statement under the following captions is incorporated herein by reference:
“Summary Term Sheet”
“Special Factors—Background of the Merger”
“Special Factors—Reasons for Approval of the Merger Agreement by the Special Committee and the GP Board”
“Special Factors—Opinion of Evercore – Financial Advisor to the Special Committee”
“Special Factors—Position of the Phillips 66 Filing Parties as to the Fairness of the Merger”
“Annex B: Opinion of Evercore Group L.L.C.”
| (e) | Approval of Directors. |
The information set forth in the Information Statement under the following captions is incorporated herein by reference:
“Summary Term Sheet”
“Special Factors—Background of the Merger”
“Special Factors—Reasons for Approval of the Merger Agreement by the Special Committee and the GP Board”
“Special Factors—Position of the Phillips 66 Filing Parties as to the Fairness of the Merger”
| (f) | Other Offers. |
Not applicable.
| ITEM | 9. REPORTS, OPINIONS, APPRAISALS AND NEGOTIATIONS |
Regulation M-A, Item 1015
| (a) | Report, Opinion or Appraisal. |
The discussion materials prepared by Evercore Group L.L.C. and provided to the Special Committee, dated October 26, 2022, November 2, 2022, November 13, 2022, November 14, 2022, November 15, 2022, November 29, 2022, December 7, 2022, December 14, 2022, December 17, 2022, December 19, 2022 and January 5, 2023 are set forth as Exhibits (c)(2)—(c)(14), respectively, hereto and are incorporated herein by reference. The discussion materials prepared by Barclays Capital Inc. and provided to Phillips 66, dated August 30, 2022 and January 3, 2023 are set forth as Exhibits (c)(15) and (c)(16), respectively, hereto and are incorporated herein by reference. The information set forth in the Information Statement under the following captions is incorporated herein by reference:
“Summary Term Sheet—Approval of the Merger Agreement by the Special Committee and the GP Board”
“Summary Term Sheet—Opinion of Evercore – Financial Advisor to the Special Committee”
“Summary Term Sheet—Position of the Phillips 66 Filing Parties as to the Fairness of the Merger”
“Special Factors—Background of the Merger”
“Special Factors—Reasons for Approval of the Merger Agreement by the Special Committee and the GP Board”
“Special Factors—Unaudited Financial Projections of the Partnership”
“Special Factors—Opinion of Evercore – Financial Advisor to the Special Committee”
“Special Factors—Financial Advisor Discussion Materials Provided to Phillips 66”
“Special Factors—Position of the Phillips 66 Filing Parties as to the Fairness of the Merger”
“Special Factors—Purposes and Reasons of the Phillips 66 Filing Parties for the Merger”
“Annex B: Opinion of Evercore Group L.L.C.”
| (b) | Preparer and Summary of Report, Opinion or Appraisal. |
The information set forth in the Information Statement under the following captions is incorporated herein by reference:
“Summary Term Sheet—Approval of the Merger Agreement by the Special Committee and the GP Board”
“Summary Term Sheet—Opinion of Evercore – Financial Advisor to the Special Committee”
“Special Factors—Background of the Merger”
“Special Factors—Reasons for Approval of the Merger Agreement by the Special Committee and the GP Board”
“Special Factors—Opinion of Evercore – Financial Advisor to the Special Committee”
“Special Factors—Financial Advisor Discussion Materials Provided to Phillips 66”
“Special Factors—Position of the Phillips 66 Filing Parties as to the Fairness of the Merger”
“Special Factors—Purposes and Reasons of the Phillips 66 Filing Parties for the Merger”
“Special Factors—Fees and Expenses Relating to the Merger”
“Annex B: Opinion of Evercore Group L.L.C.”
| (c) | Availability of Documents. |
The reports, opinions or appraisals referenced in this Item 9 are filed herewith and will be made available for inspection and copying at the principal executive offices of the Partnership during its regular business hours by any interested holder of Public Common Units or representative who has been so designated in writing.
| ITEM | 10. SOURCE AND AMOUNTS OF FUNDS OR OTHER CONSIDERATION |
Regulation M-A, Item 1007
| (a) | Source of Funds. |
The information set forth in the Information Statement under the following captions is incorporated herein by reference:
“Summary Term Sheet—Financing of the Merger”
“Summary Term Sheet—Fees and Expenses Relating to the Merger”
“Special Factors—Financing of the Merger”
“Special Factors—Fees and Expenses Relating to the Merger”
“The Merger Agreement”
“Annex A: Agreement and Plan of Merger”
| (b) | Conditions. |
The information set forth in the Information Statement under the following captions is incorporated herein by reference:
“Summary Term Sheet—Conditions to Completion of the Merger”
“Summary Term Sheet—Financing of the Merger”
“Summary Term Sheet—Fees and Expenses Relating to the Merger”
“Special Factors—Financing of the Merger”
“Special Factors—Fees and Expenses Relating to the Merger”
“The Merger Agreement”
“Annex A: Agreement and Plan of Merger”
| (c) | Expenses. |
The information set forth in the Information Statement under the following captions is incorporated herein by reference:
“Summary Term Sheet—Effect of Termination; Termination Expenses”
“Summary Term Sheet—Financing of the Merger”
“Summary Term Sheet—Fees and Expenses Relating to the Merger”
“Special Factors—Opinion of Evercore – Financial Advisor to the Special Committee”
“Special Factors—Financial Advisor Discussion Materials Provided to Phillips 66”
“Special Factors—Financing of the Merger”
“Special Factors—Fees and Expenses Relating to the Merger”
“The Merger Agreement”
“Annex A: Agreement and Plan of Merger”
| (d) | Borrowed Funds. |
The information set forth in the Information Statement under the following captions is incorporated herein by reference:
“Summary Term Sheet—Financing of the Merger”
“Special Factors—Financing of the Merger”
| ITEM | 11. INTEREST IN SECURITIES OF THE SUBJECT COMPANY |
Regulation M-A, Item 1008
| (a) | Securities Ownership. |
The information set forth in the Information Statement under the following captions is incorporated herein by reference:
“Summary Term Sheet”
“Special Factors—Background of the Merger”
“Special Factors—Reasons for Approval of the Merger Agreement by the Special Committee and the GP Board”
“Special Factors—Effects of the Merger”
“Special Factors—Interests of the Directors and Executive Officers of DCP GP LLC in the Merger”
“Information Concerning the Partnership”
“Information Concerning the Phillips 66 Filing Parties”
“Unit Ownership of Certain Beneficial Owners, Directors and Executive Officers”
| (b) | Securities Transactions. |
The information set forth in the Information Statement under the following caption is incorporated herein by reference:
“Certain Purchases and Sales of Common Units”
| ITEM | 12. THE SOLICITATION OR RECOMMENDATION |
Regulation M-A, Item 1012
| (a) | Solicitation or Recommendation. |
Not required by Schedule 13E-3.
| (b) | Reasons. |
Not required by Schedule 13E-3.
| (c) | Intent to Tender. |
Not required by Schedule 13E-3.
| (d) | Intent to Tender or Vote in a Going-Private Transaction. |
The information set forth in the Information Statement under the following captions is incorporated herein by reference:
“Summary Term Sheet”
“Questions and Answers”
“Special Factors—Background of the Merger”
“Special Factors—Reasons for Approval of the Merger Agreement by the Special Committee and the GP Board”
“Special Factors—Purposes and Reasons of the Phillips 66 Filing Parties for the Merger”
“Special Factors—Interests of the Directors and Executive Officers of DCP GP LLC in the Merger”
“The Merger Agreement”
“Annex A: Agreement and Plan of Merger”
| (e) | Recommendations of Others. |
The information set forth in the Information Statement under the following captions is incorporated herein by reference:
“Summary Term Sheet”
“Questions and Answers”
“Special Factors—Background of the Merger”
“Special Factors—Reasons for Approval of the Merger Agreement by the Special Committee and the GP Board”
“Special Factors—Position of the Phillips 66 Filing Parties as to the Fairness of the Merger”
“Special Factors—Purposes and Reasons of the Phillips 66 Filing Parties for the Merger”
“Special Factors—Interests of the Directors and Executive Officers of DCP GP LLC in the Merger”
“The Merger Agreement”
“Annex A: Agreement and Plan of Merger”
ITEM 13. FINANCIAL STATEMENTS
Regulation M-A, Item 1010
| (a) | Financial Information. |
The Partnership’s Annual Report on Form 10-K for the fiscal year ended December 31, 2022 and Quarterly Report on Form 10-Q for the quarterly period ended September 30, 2022 are incorporated herein by reference.
The information set forth in the Information Statement under the following captions is incorporated herein by reference:
“Special Factors—Effects of the Merger”
“Incorporation of Certain Documents by Reference”
“Where You Can Find More Information”
| (b) | Pro Forma Information. |
Not applicable. Paragraph (b) of Item 1010 of Regulation M-A requires the presentation of such pro forma data only if material. The Merger Consideration will consist solely of cash, and, as a result, the Public Unitholders will not have a continuing interest in the Partnership after the Merger. Additionally, the Merger is not subject to any financing condition and Phillips 66 does not anticipate any difficulties obtaining the cash required to fund the Merger. Accordingly, such pro forma data is not material to the Public Unitholders and has not been presented.
ITEM 14. PERSONS/ASSETS, RETAINED, EMPLOYED, COMPENSATED OR USED
Regulation M-A, Item 1009
| (a) | Solicitations or Recommendations. |
The information set forth in the Information Statement under the following captions is incorporated herein by reference:
“Summary Term Sheet”
“Questions and Answers”
“Special Factors—Background of the Merger”
“Special Factors—Reasons for Approval of the Merger Agreement by the Special Committee and the GP Board”
“Special Factors—Opinion of Evercore – Financial Advisor to the Special Committee”
“Special Factors—Financial Advisor Discussion Materials Provided to Phillips 66”
“Special Factors—Position of the Phillips 66 Filing Parties as to the Fairness of the Merger”
“Special Factors—Interests of the Directors and Executive Officers of DCP GP LLC in the Merger”
“Special Factors—Fees and Expenses Relating to the Merger”
| (b) | Employees and Corporate Assets. |
The information set forth in the Information Statement under the following captions is incorporated herein by reference:
“Summary Term Sheet”
“Questions and Answers”
“Special Factors—Background of the Merger”
“Special Factors—Reasons for Approval of the Merger Agreement by the Special Committee and the GP Board”
“Special Factors—Interests of the Directors and Executive Officers of DCP GP LLC in the Merger”
“Special Factors—Fees and Expenses Relating to the Merger”
ITEM 15. ADDITIONAL INFORMATION
Regulation M-A Item 1011
| (a) | Agreements, Regulatory Requirements and Legal Proceedings. |
Not required by Schedule 13E-3.
| (b) | Golden Parachute Compensation. |
The information set forth in the Information Statement under the following captions is incorporated herein by reference:
“Summary Term Sheet—Interests of the Directors and Executive Officers of DCP GP LLC in the Merger”
“Special Factors—Interests of the Directors and Executive Officers of DCP GP LLC in the Merger”
“The Merger Agreement”
“Unit Ownership of Certain Beneficial Owners, Directors and Executive Officers”
“Annex A: Agreement and Plan of Merger”
| (c) | Other Material Information. |
The information set forth in the Information Statement, including all annexes thereto, is incorporated herein by reference.
ITEM 16. EXHIBITS
Regulation M-A, Item 1016
| Exhibit |
Description | |
| (a)(1) | Preliminary Information Statement of DCP Midstream, LP (incorporated herein by reference to DCP Midstream, LP’s Information Statement on Schedule 14C filed concurrently with the SEC). | |
| (a)(2) | Press release issued by DCP Midstream, LP and Phillips 66, dated January 6, 2023 (incorporated by reference to Exhibit 99.1 to DCP Midstream, LP’s Current Report on Form 8-K filed on January 6, 2023). | |
| (a)(3) | Letter to DCP Midstream, LP’s limited partners (incorporated herein by reference to the Information Statement filed herewith as Exhibit (a)(1)). | |
| (c)(1) | Opinion of Evercore Group L.L.C. to the Special Committee of the Board of Directors of DCP Midstream GP, LLC, dated January 5, 2023 (incorporated herein by reference to Annex B to the Information Statement filed herewith as Exhibit (a)(1)). | |
| (c)(2) | Discussion materials prepared by Evercore Group L.L.C., dated October 26, 2022, for the Special Committee of the Board of Directors of DCP Midstream GP, LLC. | |
| (c)(3) | Discussion materials prepared by Evercore Group L.L.C., dated November 2, 2022, for the Special Committee of the Board of Directors of DCP Midstream GP, LLC. | |
| (c)(4) | Discussion materials prepared by Evercore Group L.L.C., dated November 13, 2022, for the Special Committee of the Board of Directors of DCP Midstream GP, LLC. | |
| (c)(5) | Discussion materials prepared by Evercore Group L.L.C., dated November 14, 2022, for the Special Committee of the Board of Directors of DCP Midstream GP, LLC. | |
| (c)(6) | Discussion materials prepared by Evercore Group L.L.C., dated November 15, 2022, for the Special Committee of the Board of Directors of DCP Midstream GP, LLC. | |
| (c)(7) | Discussion materials prepared by Evercore Group L.L.C., dated November 15, 2022, for the Special Committee of the Board of Directors of DCP Midstream GP, LLC. | |
| (c)(8) | Discussion materials prepared by Evercore Group L.L.C., dated November 29, 2022, for the Special Committee of the Board of Directors of DCP Midstream GP, LLC. | |
| (c)(9) | Discussion materials prepared by Evercore Group L.L.C., dated December 7, 2022, for the Special Committee of the Board of Directors of DCP Midstream GP, LLC. | |
| (c)(10) | Discussion materials prepared by Evercore Group L.L.C., dated December 14, 2022, for the Special Committee of the Board of Directors of DCP Midstream GP, LLC. | |
| (c)(11) | Discussion materials prepared by Evercore Group L.L.C., dated December 17, 2022, for the Special Committee of the Board of Directors of DCP Midstream GP, LLC. | |
| (c)(12) | Discussion materials prepared by Evercore Group L.L.C., dated December 19, 2022, for the Special Committee of the Board of Directors of DCP Midstream GP, LLC. | |
| (c)(13) | Discussion materials prepared by Evercore Group L.L.C., dated January 5, 2023, for the Special Committee of the Board of Directors of DCP Midstream GP, LLC. | |
| (c)(14) | Discussion materials prepared by Evercore Group L.L.C., dated January 5, 2023, for the Special Committee of the Board of Directors of DCP Midstream GP, LLC. | |
| (c)(15) | Discussion materials prepared by Barclays, dated August 30, 2022, for Phillips 66. | |
| (c)(16) | Discussion materials prepared by Barclays, dated January 3, 2023, for Phillips 66. | |
| (d)(1) | Agreement and Plan of Merger, dated as of January 5, 2023, by and among Phillips 66, Phillips 66 Project Development Inc., Dynamo Merger Sub LLC, DCP Midstream, LP, DCP Midstream GP, LP and DCP Midstream GP, LLC (incorporated herein by reference to Annex A to the Information Statement filed herewith as Exhibit (a)(1)). | |
| (f)(1) | Fifth Amended and Restated Agreement of Limited Partnership of DCP Midstream, LP, dated as of November 6, 2019 (incorporated by reference to Exhibit 3.1 to DCP Midstream, LP’s Current Report on Form 8-K filed on November 8, 2019). | |
| (f)(2) | Delaware Code Title 6 § 17-212. | |
| (107) | Filing Fee Table. | |
SIGNATURES
After due inquiry and to the best of each of the undersigned’s knowledge and belief, each of the undersigned certifies that the information set forth in this statement is true, complete and correct.
| Dated as of March 22, 2023 | DCP MIDSTREAM, LP | |||||
| By: DCP Midstream GP, LP its General Partner | ||||||
| By: DCP Midstream GP, LLC its General Partner | ||||||
| By: | /s/ Donald A. Baldridge | |||||
| Name: Donald A. Baldridge | ||||||
| Title: Interim Chief Executive Officer | ||||||
| Dated as of March 22, 2023 | DCP MIDSTREAM GP, LLC | |||||
| By: | /s/ Kamal Gala | |||||
| Name: Kamal Gala | ||||||
| Title: Corporate Secretary | ||||||
| Dated as of March 22, 2023 | DCP MIDSTREAM GP, LP | |||||
| By: DCP Midstream GP, LLC its General Partner | ||||||
| By: | /s/ Kamal Gala | |||||
| Name: Kamal Gala | ||||||
| Title: Corporate Secretary | ||||||
| Dated as of March 22, 2023 | DCP MIDSTREAM, LLC | |||||
| By: Phillips Gas Company LLC its Class A Managing Member | ||||||
| By: | /s/ Kevin J. Mitchell | |||||
| Name: Kevin J. Mitchell | ||||||
| Title: President | ||||||
| Dated as of March 22, 2023 | PHILLIPS 66 | |||||
| By: | /s/ Timothy D. Roberts | |||||
| Name: Timothy D. Roberts | ||||||
| Title: Executive Vice President, Midstream and Chemicals | ||||||
| Dated as of March 22, 2023 | PHILLIPS 66 PROJECT DEVELOPMENT INC. | |||||
| By: | /s/ Timothy D. Roberts | |||||
| Name: Timothy D. Roberts | ||||||
| Title: President | ||||||
| Dated as of March 22, 2023 | PHILLIPS GAS COMPANY LLC | |||||
| By: | /s/ Kevin J. Mitchell | |||||
| Name: Kevin J. Mitchell | ||||||
| Title: President | ||||||
| Dated as of March 22, 2023 | DYNAMO MERGER SUB LLC | |||||
| By: | /s/ Timothy D. Roberts | |||||
| Name: Timothy D. Roberts | ||||||
| Title: President | ||||||
Exhibit (c)(2)

Preliminary Draft – Confidential Discussion Materials Prepared for the Special Committee of the Board of Directors of DCP Midstream GP, LLC October 26, 2022

Preliminary Draft – Confidential These materials have been prepared by Evercore Group L.L.C. (“Evercore”) for the Special Committee (the “Special Committee”) of the Board of Directors of DCP Midstream GP, LLC, the general partner of DCP Midstream, LP (“DCP” or the “Partnership”) to whom such materials are directly addressed and delivered and may not be used or relied upon for any purpose other than as specifically contemplated. These materials are based on information provided by or on behalf of the Partnership and/or other potential transaction participants, from public sources or otherwise reviewed by Evercore. Evercore assumes no responsibility for independent investigation or verification of such information and has relied on such information being complete and accurate in all material respects. To the extent such information includes estimates and forecasts of future financial performance prepared by or reviewed with the management of the Partnership and/or other potential transaction participants or obtained from public sources, Evercore has assumed that such estimates and forecasts have been reasonably prepared on bases reflecting the best currently available estimates and judgments of such management (or, with respect to estimates and forecasts obtained from public sources, represent reasonable estimates). No representation or warranty, express or implied, is made as to the accuracy or completeness of such information and nothing contained herein is, or shall be relied upon as, a representation, whether as to the past, the present or the future. These materials were designed for use by specific persons familiar with the business and affairs of the Partnership. These materials are not intended to provide the sole basis for evaluating, and should not be considered a recommendation with respect to, any transaction or other matter. These materials have been developed by and are proprietary to Evercore and were prepared exclusively for the benefit and internal use of the Special Committee. These materials were compiled on a confidential basis for use of the Special Committee in evaluating the potential transaction described herein and not with a view to public disclosure or filing thereof under state or federal securities laws, and may not be reproduced, disseminated, quoted or referred to, in whole or in part, without the prior written consent of Evercore. These materials do not constitute an offer or solicitation to sell or purchase any securities and are not a commitment by Evercore (or any affiliate) to provide or arrange any financing for any transaction or to purchase any security in connection therewith. Evercore assumes no obligation to update or otherwise revise these materials. These materials may not reflect information known to other professionals in other business areas of Evercore and its affiliates. Evercore and its affiliates do not provide legal, accounting or tax advice. Accordingly, any statements contained herein as to tax matters were neither written nor intended by Evercore or its affiliates to be used and cannot be used by any taxpayer for the purpose of avoiding tax penalties that may be imposed on such taxpayer. Each person should seek legal, accounting and tax advice based on his, her or its particular circumstances from independent advisors regarding the impact of the transactions or matters described herein.


Preliminary Draft – Confidential Table of Contents Section Executive Summary I DCP Situation Analysis II LPG Market Overview III DCP Financial Projections IV Preliminary Valuation of the Common Units V Next Steps and Follow-Up VI Appendix A. Weighted Average Cost of Capital Analysis

Preliminary Draft – Confidential I. Executive Summary Preliminary Draft – Confidential Executive Summary Introduction and Overview of Materials â—¼ï€ Evercore Group L.L.C. (“Evercore”) is pleased to provide the following materials to the Special Committee of the Board of DCP Midstream GP, LLC (the “Special Committee”), the general partner of DCP Midstream LP (“DCP” or the “Partnership”), regarding the proposed acquisition by Phillips 66 and its affiliates (collectively, “PSX,” “Phillips 66” or the “Company”) of all of the outstanding common units (the “Common Units”) of the Partnership not already owned by Phillips 66, Enbridge, Inc. (“ENB”) and their affiliates (the “Unaffiliated Unitholders”), for cash (the “Proposed Transaction” or “Project Dynamo”) ï,„ï€ PSX, ENB and their affiliates currently own 117,762,526 DCP Common Units1 • 56.5% of the total outstanding common units ï,„ï€ PSX has proposed to acquire each outstanding DCP common unit at a value equal to $34.75 as of August 17, 2022 (the “Proposed Consideration”) in an all-cash transaction • Implies an at market offer as of August 17, 2022 â—¼ï€ The Evercore analysis reviews valuation in terms of absolute unit price for DCP based on the financial projections for DCP as provided by DCP management (the “DCP Financial Projections”) Source: DCP Management, FactSet 1. As of 8/26/22 1

Preliminary Draft – Confidential Executive Summary Overview of the Transaction Counterparty â—¼ï€ Phillips 66 (NYSE: PSX) â—¼ï€ PSX to acquire 100% of the Common Units owned by the Unaffiliated Unitholders Transaction Summary â—¼ï€ DCP will cease to be a publicly-traded partnership Proposed â—¼ï€ $34.75 in cash per Common Unit Consideration â—¼ï€ Approval of the Special Committee and the board of directors of the general partner of DCP Timing and Approvals â—¼ï€ Regulatory filing requirements to be confirmed â—¼ï€ The Proposed Transaction is taxable to the Unaffiliated Unitholders resulting in the realization of taxes Other on deferred income and capital gains 2

Preliminary Draft – Confidential Executive Summary Summary Organizational Structure and Transaction Economics ($ in millions, except per unit amounts) Current Ownership Structure (As-Converted) Sources and Uses Sources Cash $3,149 Total Sources $3,149 Uses Units Price Economic Interests Economic Interests Public Common Units (mm) 91 $34.75 $3,149 43.31% DCP Midstream, LP 13.20% DCP Midstream, LP Total Uses $3,149 Transaction Economics Proposed Consideration $34.75 DCP Midstream, LLC (Merged JV) Common Units Outstanding1,2 (mm) 210 Phillips 66 oversees and manages DCP Total Equity Value $7,285 100.00% GP, 56.51% LP Plus: Preferred Equity @ 12/31/22 271 Plus: DCP Net Debt @ 12/31/22 5,331 Plus: Noncontrolling Interests 25 Total Implied Enterprise Value $12,912 DCP Midstream, LP (NYSE:DCP) Common Market Capitalization1,2: $8,258mm Implied EV/EBITDA (DCP Financial Projections) Metric Multiple Preferred Equity: $751mm 2022E $1,749 7.4x Net Debt: $5,279mm Enterprise Value: $14,313mm 2023E 1,698 7.6 Implied EV/EBITDA (Wall Street Consensus Estimates) 2022E $1,777 7.3x 2023E 1,762 7.3 Public Unitholders 90,622,632 Common Units 43.49% Public Interest Interests to be acquired in the Proposed Transaction Source: DCP Management, FactSet, Wall St Research; Proposed transaction Sources and Uses assumes 12/31 balance sheet date per management model 1. As of October 21, 2022; Includes 117.8mm common units held by DCP Midstream, LLC and DCP Midstream GP, LP | 2. Includes 1.3mm phantom and performance units 3

Preliminary Draft – Confidential Executive Summary DCP Common Unit Price Prior to the Unaffected Date of August 17, 2022 Offer Premium DCP Price Relative to Historical Average Proposed Consideration $34.75 YTD 2022 Average $33.69 3.2% Last 20 Trading Days Average $37.93 (8.4%) Last 30 Trading Days Average $37.98 (8.5%) Last 60 Trading Days Average $37.23 (6.7%) Last 6 Months Average $34.94 (0.5%) Last 12 Months Average $32.63 6.5% $40.00 $39.39 $37.98 $37.93 Proposed Consideration $34.75 $37.23 $35.00 $34.94 $33.69 $32.63 $30.00 $25.00 $20.00 Offer Date: 8/17/22 $15.00 1/1/21 5/12/21 9/21/21 1/30/22 6/11/22 10/21/22 Historical Price (DCP) Proposed Consideration YTD 2022 Average Last 20 Trading Days Average Last 30 Trading Days Average Last 60 Trading Days Average Last 6 Months Average Last 12 Months Average Source: FactSet; as of October 21, 2022 4
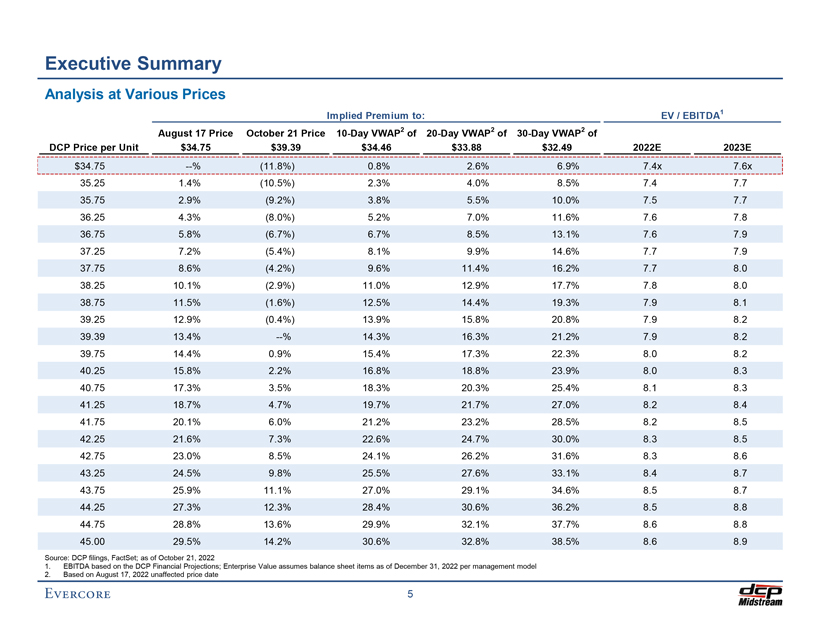
Preliminary Draft – Confidential Executive Summary Analysis at Various Prices Implied Premium to: EV / EBITDA1 August 17 Price October 21 Price 10-Day VWAP2 of 20-Day VWAP2 of 30-Day VWAP2 of DCP Price per Unit $34.75 $39.39 $34.46 $33.88 $32.49 2022E 2023E $34.75 —% (11.8%) 0.8% 2.6% 6.9% 7.4x 7.6x 35.25 1.4% (10.5%) 2.3% 4.0% 8.5% 7.4 7.7 35.75 2.9% (9.2%) 3.8% 5.5% 10.0% 7.5 7.7 36.25 4.3% (8.0%) 5.2% 7.0% 11.6% 7.6 7.8 36.75 5.8% (6.7%) 6.7% 8.5% 13.1% 7.6 7.9 37.25 7.2% (5.4%) 8.1% 9.9% 14.6% 7.7 7.9 37.75 8.6% (4.2%) 9.6% 11.4% 16.2% 7.7 8.0 38.25 10.1% (2.9%) 11.0% 12.9% 17.7% 7.8 8.0 38.75 11.5% (1.6%) 12.5% 14.4% 19.3% 7.9 8.1 39.25 12.9% (0.4%) 13.9% 15.8% 20.8% 7.9 8.2 39.39 13.4% —% 14.3% 16.3% 21.2% 7.9 8.2 39.75 14.4% 0.9% 15.4% 17.3% 22.3% 8.0 8.2 40.25 15.8% 2.2% 16.8% 18.8% 23.9% 8.0 8.3 40.75 17.3% 3.5% 18.3% 20.3% 25.4% 8.1 8.3 41.25 18.7% 4.7% 19.7% 21.7% 27.0% 8.2 8.4 41.75 20.1% 6.0% 21.2% 23.2% 28.5% 8.2 8.5 42.25 21.6% 7.3% 22.6% 24.7% 30.0% 8.3 8.5 42.75 23.0% 8.5% 24.1% 26.2% 31.6% 8.3 8.6 43.25 24.5% 9.8% 25.5% 27.6% 33.1% 8.4 8.7 43.75 25.9% 11.1% 27.0% 29.1% 34.6% 8.5 8.7 44.25 27.3% 12.3% 28.4% 30.6% 36.2% 8.5 8.8 44.75 28.8% 13.6% 29.9% 32.1% 37.7% 8.6 8.8 45.00 29.5% 14.2% 30.6% 32.8% 38.5% 8.6 8.9 Source: DCP filings, FactSet; as of October 21, 2022 1. EBITDA based on the DCP Financial Projections; Enterprise Value assumes balance sheet items as of December 31, 2022 per management model 2. Based on August 17, 2022 unaffected price date 5

Preliminary Draft – Confidential Executive Summary Side-by-Side Analysis ($ in millions, except per unit / share amounts) DCP PSX Total Units Outstanding1 210 Fully-Diluted Shares Outstanding 486 Common Unit Price $39.39 Common Share Price $100.44 Total Equity Value $8,258 Total Equity Value $48,769 Plus: Preferred Equity 751 Plus: Net Debt 10,160 Plus: Net Debt 5,279 Plus: Noncontrolling Interest 297 Plus: Noncontrolling Interest 25 Enterprise Value $59,226 Enterprise Value $14,313 DCP Financial Projections Consensus Data Consensus Data Metric Yield/Multiple Metric Yield/Multiple Metric Yield/Multiple EV/EBITDA EV/EBITDA 2022E $1,749 8.2x $1,777 8.1x 2022E $13,137 4.5x 2023E 1,698 8.4 1,762 8.1 2023E 9,659 6.1 2024E 1,578 9.1 1,642 8.7 2024E 8,376 7.1 P / DCF per LP Unit P / FCFPS 2022E $6.12 6.4x $6.42 6.1x 2022E $16.13 6.2x 2023E 5.92 6.7 6.34 6.2 2023E 11.49 8.7 2024E 5.55 7.1 6.01 6.6 2024E 8.84 11.4 Distribution Yield Dividend Yield Current $1.72 4.4% $1.72 4.4% Current $3.88 3.9% 2023E 1.72 4.4% 1.80 4.6% 2023E 3.94 3.9% 2024E 1.72 4.4% 1.89 4.8% 2024E 4.15 4.1% Distribution Coverage Dividend Coverage 2022E $6.12 3.7x $6.42 3.8x 2022E $16.13 4.2x 2023E 5.92 3.4 6.34 3.5 2023E 11.49 2.9 2024E 5.55 3.2 6.01 3.2 2024E 8.84 2.1 Note: As of October 21, 2022; Balance sheet data per Partnership / Company filings as of June 30, 2022; DCP debt pro forma for James Lake system acquisition Source: FactSet, company filings, DCP Management 1. Includes 117.8mm common units held by DCP Midstream, LLC and DCP Midstream GP, LP, and 1.3mm phantom and performance units 6

Preliminary Draft – Confidential II. DCP Situation Analysis

Preliminary Draft – Confidential DCP Situation Analysis Partnership Overview Description Asset Map â—¼ï€ DCP is a Delaware limited partnership formed to own and operate a diversified portfolio of midstream energy assets â—¼ï€ Two reportable segments: Logistics and Marketing; Gathering and Processing ï,„ï€ Logistics and Marketing includes fractionating NGLs as well as transporting, trading, marketing and storing natural gas and NGLs ï,„ï€ Gathering and Processing includes gathering, compressing, treating, and processing natural gas, as well as producing and fractionating NGLs and recovering condensate â—¼ï€ Credit rating: Ba1 (Moody’s); BBB+ (S&P) Volumes By Segment (Q2’22) NGL Pipeline Volume and Utilization Q2’22 Avg. Q2’22 Pipeline (MBbls/d) Throughput Utilization Sand Hills 304 91% Southern Hills 122 95% Front Range 78 90% Texas Express 23 62% Other 193 62% Total 720 80% G&P Volume and Utilization Q2’22 Avg. Q2’22 Plant (MMcf/d) Wellhead Vol. Utilization North 1,578 100% Midcontinent 838 75% Permian 982 89% South 985 60% Total 4,383 81% 7 Source: DCP 2Q’22 Investor Presentation

Preliminary Draft – Confidential DCP Situation Analysis Logistics and Marketing Overview Logistics & Marketing segment is fee-based or fee-like and includes NGL and gas takeaway pipelines, marketing, trading, storage and fractionators % Ownership / DCP Logistics Assets Segment Description Operated â—¼ï€ Sand Hills provides NGL takeaway / Cheyenne Connector from the Permian and Eagle Ford to 67% ï¡ â—¼ï€ Operated by Tallgrass the Gulf Coast â—¼ï€ DCP 50% Owner â—¼ï€ Southern Hills provides NGL 67% / ï¡ï€ takeaway from the DJ Basin and the NGL Midcontinent to Gulf Coast markets Takeaway â—¼ï€ Front Range / Texas Express provide NGL takeaway from the DJ 33% / 10% / Basinï² â–º Both operated by Enterprise Southern Hills Products Partners L.P. (“EPD”) Front Range â—¼ï€ DCP 67% owner â—¼ï€ Operated by EPD â—¼ï€ Gulf Coast Express provides ~2.0 25% / ï² â—¼ï€ DCP 33% owner Bcf/d gas takeaway from the Texas Express Permian to the Gulf Coast â—¼ï€ Operated by EPD Gulf Coast Express â—¼ï€ DCP 10% Owner â–º Operated by Kinder Morgan, â—¼ï€ Operated by KMI Inc. (“KMI”) â—¼ï€ DCP 25% owner â—¼ï€ Guadalupe provides 245 MMcf/d Gas 50% / ï²ï€ gas takeaway from the Permian Takeaway â—¼ï€ Cheyenne Connector provides 600 Mont Belvieu 50% / ï² MMcf/d gas takeaway from the DJ â—¼ï€ DCP 12.5% owner Basin to the Rockies Express in the Enterprise fractionator Pipeline â—¼ï€ DCP 20% owner in â–º Operated by Tallgrass Energy Mont Belvieu 1 Partners, LP (“Tallgrass”) fractionator â—¼ï€ 12 Bcf Spindletop natural gas 100% / ï¡ï€ storage facility in SE Texas Legend: Gas & NGL â—¼ï€ 8 MMBbls Marysville NGL storage Storage 100% / ï¡ DCP operated facility in Michigan Third party operated â—¼ï€ Equity ownership of 56 MBpd of Guadalupe Market Hub 12.5% / 20% / Mont Belvieu fractionation â—¼ï€ Waha to New Braunfels 50%/50% DCP/EPD Sand Hillsï²ï€ NGL or Natural Fractionation capacity â—¼ï€ New Braunfels to Dewville 100% DCP â—¼ï€ DCP 67% owner Gas Pipeline â—¼ï€ Additional field fractionation â—¼ï€ Dewville to Katy 50%/50% DCP/ETC Katy â—¼ï€ Katy Header 100% DCP capacity of 70 MBpd 8

Preliminary Draft – Confidential DCP Situation Analysis Gathering and Processing Overview North Assets Permian Assets South Assets Midcontinent Assets / James Lake Asset type Fractionator & Plant Natural Gas Plant NGL Pipeline Natural Gas Pipeline DJ Basin Delaware Basin Eagle Ford SCOOP/STACK â—¼ï€ 10 active plants â—¼ï€ 4 active plants â—¼ï€ 4 active plants â—¼ï€ 5 active plants â—¼ï€ 1,160 MMcf/d capacity â—¼ï€ 640 MMcf/d capacity â—¼ï€ 690 MMcf/d capacity â—¼ï€ 560 MMcf/d capacity â—¼ï€ ~3,000 miles of gathering â—¼ï€ ~6,700 miles of gathering â—¼ï€ ~5,000 miles of gathering â—¼ï€ ~10,000 miles of gathering Michigan/Collbran Midland Basin/Other East Texas Liberal/Panhandle â—¼ï€ 3 active treaters â—¼ï€ 7 active plants â—¼ï€ 1 active plant â—¼ï€ 1 active plant â—¼ï€ 420 MMcf/d capacity â—¼ï€ 700 MMcf/d capacity â—¼ï€ 400 MMcf/d capacity â—¼ï€ 550 MMcf/d capacity â—¼ï€ ~500 miles of gathering â—¼ï€ ~8,700 miles of gathering â—¼ï€ ~1,000 miles of gathering â—¼ï€ ~13,500 miles of gathering Select Customers Select Customers Gulf Coast/Other Select Customers â—¼ï€ 2 active plants â—¼ï€ 540 MMcf/d capacity â—¼ï€ ~1000 miles of gathering Select Customers Note: Number of active processing plants and active plant capacity excludes idled plants and includes DCP’s proportionate ownership share of capacity. Delaware Basin includes recently acquired James Lake System 9

Preliminary Draft – Confidential DCP Situation Analysis DCP Organizational Structure Economic Interests Economic Interests 43.31% DCP Midstream, LP 13.20% DCP Midstream, LP 6.50% Gray Oak Pipeline, LLC 58.50% Gray Oak Pipeline, LLC DCP Midstream, LLC (Merged JV) Phillips 66 oversees and manages DCP GP and LP interests Enbridge oversees and manages GOP interest Public Other JV Unitholders Partners 43.49% LP 100.00% GP 56.51% LP 65.00% 35.00% Source: Public filings 10

Preliminary Draft – Confidential DCP Situation Analysis ($ in millions, except per unit amounts) Market Capitalization Balance Sheet and Credit Data As of October 21, 2022 As of June 30, 2022 Total Units Outstanding1 210 Cash and Marketable Securities $8 Common Unit Price $39.39 Short-Term Debt 505 Total Equity Value $8,258 Long-Term Debt2 4,782 Plus: Preferred Equity 751 Total Debt $5,287 Plus: Net Debt 5,279 Net Debt $5,279 Plus: Noncontrolling Interest 25 Plus: Noncontrolling Interest 25 Enterprise Value $14,313 Plus: Preferred Equity 751 Plus: Partners’ Capital 5,374 DCP Financial Projections Consensus Data Net Book Capitalization $11,429 Metric Yield/Multiple Metric Yield/Multiple Distribution Yield Revolver Availability / Total Revolver Capacity2 $1,220 / $1,400 Current $1.72 4.4% $1.72 4.4% Net Debt / Net Book Cap 46.2% 2022E 1.64 4.2% 1.68 4.3% Net Debt / 2022E EBITDA 3.0x 2023E 1.72 4.4% 1.80 4.6% Net Debt / 2023E EBITDA 3.0 EV/EBITDA 2022E $1,749 8.2x $1,777 8.1x 2023E 1,698 8.4 1,762 8.1 2024E 1,578 9.1 1,642 8.7 Unit Price and Distribution $45.00 $2.50 Proposed Consideration: $34.75 Price $30.00 $2.00 Distribution Unitper $15.00 $1.50 Unit $— $1.00 10/21/20 2/19/21 6/21/21 10/21/21 2/19/22 6/21/22 10/21/22 Distribution per Unit Unit Price Source: DCP filings, FactSet as of October 21, 2022 1. Includes 117.8mm common units held by DCP Midstream, LLC and DCP Midstream GP, LP, and 1.3mm phantom and performance units 2. Pro forma for the $160mm James Lake System acquisition from Woodland Midstream II 11

$1.68 RBC Wells Stifel Source: Mizuho $1.68 DCP Raymond $1.64 DCP FactSet, Fargo Firm $1.68 James Wall 2022E public $1.62 Raymond filings; $1.68 . J as $1.72 Street . R of James Elvira Michael Gabriel Selman Situation October 2022E $1.84 $1.81 Distribution Scotto Blum Akyol Weston 21, 2022 $1.82 Per Moreen Analyst Stifel 2023E $1.75 Research $1.79 Unit Summary $1.80 Analysis $1.72 Date Price 8/17/22 8/25/22 9/14/22 10/14/22 10/18/22 NA Estimates Mizuho $1.93 Low: High: Mean: Targets $2.02 Median: 2024E $1.80 Hold Buy Buy Buy Buy NA $1.89 Recommendation Wells $1.72 12 Fargo 2023E Target $1,750 38 45 43 45 $ 38 45 45 45 $ 45 $1,776 . 00 00 . 60 . . 00 00 . 00 . . 00 . 00 00 . Price $1,804 RBC 2022E $1,805 $1,822 $1,777 $1,749 $ ( $1,750 in FactSet $1,750 $1,773 EBITDA $1,773 Analyst 2023E 80% Buy $2,012 millions, Consensus $1,762 $1,698 Estimates except 2024E Preliminary NA per $1,642 20% Hold Draft $1,665 unit – 2024E $1,638 Recommendations Management NA $1,642 $1,578 amounts) Confidential

Preliminary Draft – Confidential DCP Situation Analysis Analyst Price Targets and Comparison of Valuation Methodologies Price Target Date Broker Valuation Methodology Based on a blend of: (1) a three-stage distribution/dividend discount model, which assumes a 10% required rate of return and a long-term decline rate of -1.0%; (2) a three-stage discounted free cash flow analysis using a discount $45.00 25-Aug-22 rate of 8.1% and a long-term decline rate of -1.0%; and (3) a sum-of-the-parts valuation based on WF’s 2023 forecast $38 price target using PSX’s $34.75 offer price and adding a 10% premium, based on some previous transactions $38.00 17-Aug-22 in the space. The $38 price target represents an overall EV/EBITDA of ~6.9x and a target yield of 4.3% off of RBC’s one-year-out annualized distribution estimate $45.00 14-Oct-22 Derived by applying a 9.0x multiple to Stifel’s 2023 EBITDA estimate of $1.75 billion Blended valuation based on: (1) a 10-year, three-stage distribution/dividend discount model; (2) forward free cash $45.00 18-Oct-22 flow yield relative to comparable industry peers; and (3) forward enterprise value-to-EBITDA multiples relative to comparable industry peers Premium / (Discount) 14.2% (3.5%) 14.2% 14.2% to Current $45.00 $45.00 $45.00 Current Unit Price¹: $39.39 $38.00 Proposed Consideration: $34.75 Source: Wall Street research, FactSet 1. Unit price as of October 21, 2022 13
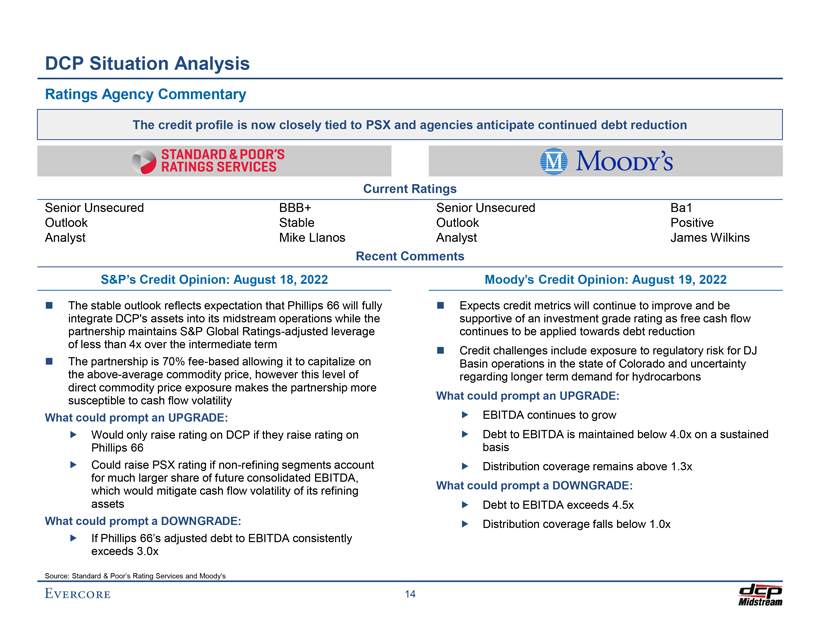
Preliminary Draft – Confidential DCP Situation Analysis Ratings Agency Commentary The credit profile is now closely tied to PSX and agencies anticipate continued debt reduction Current Ratings Senior Unsecured BBB+ Senior Unsecured Ba1 Outlook Stable Outlook Positive Analyst Mike Llanos Analyst James Wilkins Recent Comments S&P’s Credit Opinion: August 18, 2022 Moody’s Credit Opinion: August 19, 2022 The stable outlook reflects expectation that Phillips 66 will fully Expects credit metrics will continue to improve and be integrate DCP’s assets into its midstream operations while the supportive of an investment grade rating as free cash flow partnership maintains S&P Global Ratings-adjusted leverage continues to be applied towards debt reduction of less than 4x over the intermediate term Credit challenges include exposure to regulatory risk for DJ The partnership is 70% fee-based allowing it to capitalize on Basin operations in the state of Colorado and uncertainty the above-average commodity price, however this level of regarding longer term demand for hydrocarbons direct commodity price exposure makes the partnership more susceptible to cash flow volatility What could prompt an UPGRADE: What could prompt an UPGRADE: EBITDA continues to grow Would only raise rating on DCP if they raise rating on Debt to EBITDA is maintained below 4.0x on a sustained Phillips 66 basis Could raise PSX rating if non-refining segments account Distribution coverage remains above 1.3x for much larger share of future consolidated EBITDA, What could prompt a DOWNGRADE: which would mitigate cash flow volatility of its refining assets Debt to EBITDA exceeds 4.5x What could prompt a DOWNGRADE: Distribution coverage falls below 1.0x If Phillips 66’s adjusted debt to EBITDA consistently exceeds 3.0x Source: Standard & Poor’s Rating Services and Moody’s 14
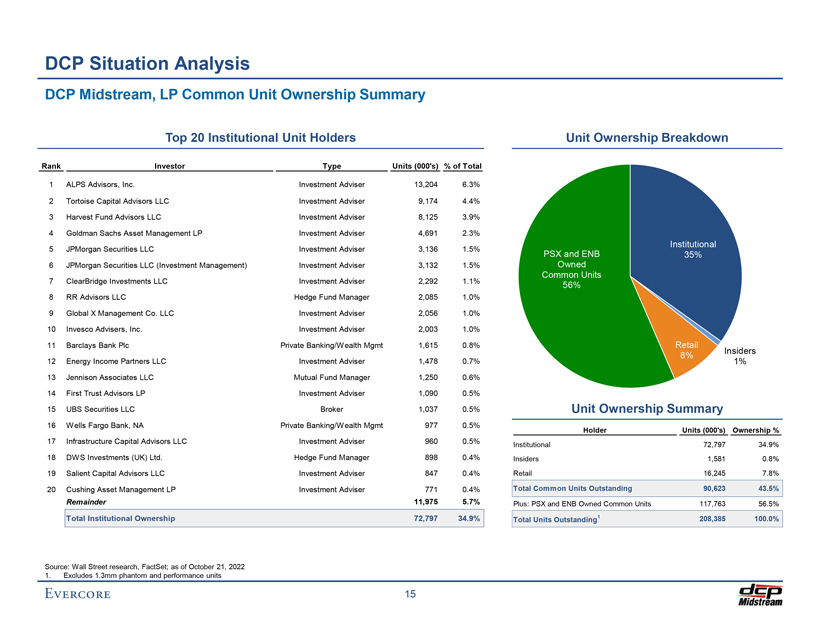
Preliminary Draft – Confidential DCP Situation Analysis DCP Midstream, LP Common Unit Ownership Summary Top 20 Institutional Unit Holders Unit Ownership Breakdown Rank Investor Type Units (000’s) % of Total 1 ALPS Advisors, Inc. Investment Adviser 13,204 6.3% 2 Tortoise Capital Advisors LLC Investment Adviser 9,174 4.4% 3 Harvest Fund Advisors LLC Investment Adviser 8,125 3.9% 4 Goldman Sachs Asset Management LP Investment Adviser 4,691 2.3% Institutional 5 JPMorgan Securities LLC Investment Adviser 3,136 1.5% PSX and ENB 35% 6 JPMorgan Securities LLC (Investment Management) Investment Adviser 3,132 1.5% Owned Common Units 7 ClearBridge Investments LLC Investment Adviser 2,292 1.1% 56% 8 RR Advisors LLC Hedge Fund Manager 2,085 1.0% 9 Global X Management Co. LLC Investment Adviser 2,056 1.0% 10 Invesco Advisers, Inc. Investment Adviser 2,003 1.0% 11 Barclays Bank Plc Private Banking/Wealth Mgmt 1,615 0.8% Retail Insiders 8% 12 Energy Income Partners LLC Investment Adviser 1,478 0.7% 1% 13 Jennison Associates LLC Mutual Fund Manager 1,250 0.6% 14 First Trust Advisors LP Investment Adviser 1,090 0.5% 15 UBS Securities LLC Broker 1,037 0.5% Unit Ownership Summary 16 Wells Fargo Bank, NA Private Banking/Wealth Mgmt 977 0.5% Holder Units (000’s) Ownership % 17 Infrastructure Capital Advisors LLC Investment Adviser 960 0.5% Institutional 72,797 34.9% 18 DWS Investments (UK) Ltd. Hedge Fund Manager 898 0.4% Insiders 1,581 0.8% 19 Salient Capital Advisors LLC Investment Adviser 847 0.4% Retail 16,245 7.8% 20 Cushing Asset Management LP Investment Adviser 771 0.4% Total Common Units Outstanding 90,623 43.5% Remainder 11,975 5.7% Plus: PSX and ENB Owned Common Units 117,763 56.5% Total Institutional Ownership 72,797 34.9% Total Units Outstanding1 208,385 100.0% Source: Wall Street research, FactSet; as of October 21, 2022 1. Excludes 1.3mm phantom and performance units 15

Preliminary Draft – Confidential III. LPG Market Overview

Preliminary Draft – Confidential LPG Market Overview Overview Gulf Coast LPG Export Market â—¼ï€ Global Demand: Significant and persistent global demand Permian Basin NGL Pipelines to Gulf Coast Market for LPGs is primarily driven by Asian markets, which lack both local petroleum feedstock and local refining and/or 3,700 processing infrastructure 3,200 â—¼ï€ U.S. Surplus: Rapid growth in U.S. domestic oil and gas 2,700 production has resulted in LPGs exceeding domestic MBpd demand with domestic demand for LPGs remaining relatively 2,200 flat over the past two decades and projected to remain 1,700 relatively flat over the near-to-medium term 1,200 â—¼ï€ Gulf Coast Infrastructure: Several major expansions of Q4 Q1 Q2 Q3 Q4 Q1 Q2 Q3 Q4 Q1 Q2 Q3 Q4 Q1 Q2 Q3 Q4 LPG export capacity are underway to accommodate the 2018 2019 2020 2021 2022E anticipated long-term eastward flows of global LPG trade Existing Capacity Sand Hills Shin Oak â—¼ï€ Fungibility: DCP delivers significant NGL volumes primarily Grand Prix West TX LPG EPIC NGL Lone Star NGL Express to Mont Belvieu, the primary hub for both domestic and exported LPGs U.S. Domestic LPG Supply and Demand Balance 4.00 3.58 — 3.58 3.64 — 3.64 3.41 (0.03) 3.38 0.63 0.63 3.00 0.62 (MMBpd) 1.79 1.78 1.79 e 2.00 n c ala 2.79 2.96 3.01 b 1.00 1.85 LPG 1.59 1.80 US —Production Stocks Demand Production Stocks Demand Production Stocks Demand 2022E 2023E 2024E Gas plant Refinery Exports Domestic demand Source: Wall Street Research 16

Preliminary Draft – Confidential LPG Market Overview Texas Fractionation Overview Texas NGL Fractionation Capacity 5,500 5,000 4,500 MBpd 4,000 3,500 ` 3,000 Q1 Q2 Q3 Q4 Q1 Q2 Q3 Q4 Q1 Q2 Q3 Q4 Q1 Q2 Q3 Q4 Q1 Q2 Q3 Q4 2019 2020 2021 2022E 2023E Existing Capacity Energy Transfer ONEOK Enterprise Targa EPIC Philips 66 U.S. Gulf Coast Capacity Additions 350 300 300 250 200 150 125 150 150 150 125 150 150 110 110 110 110 Bp d 100 M 50 —Energy Targa Frac 6 ONEOK Frac4 Enterprise Energy Targa Frac 7 Enterprise Targa Frac 8 ONEOK Frac5 EPIC Frac 1 Phillips 66 Phillips 66 Transfer Frac Frac 10 Transfer Frac Frac 11 Frac 2&3 6 7 Q1 Q2 Q1 Q3 Q3 Q3 Q3 Q4 2019 2019 2020 2023E 2020 2020 2022E Mont Belvieu Corpus Christi Sweeny Source: Wall Street Research 17
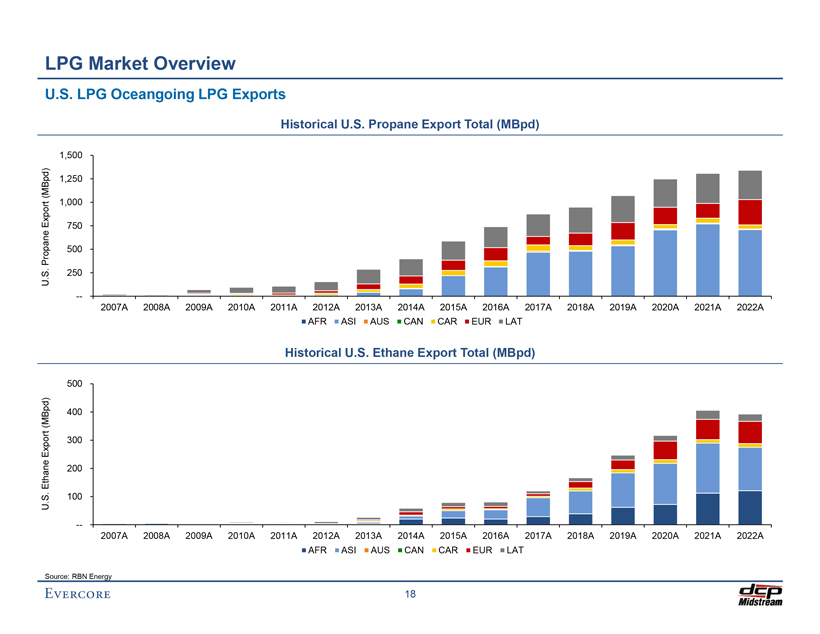
Preliminary Draft – Confidential LPG Market Overview U.S. LPG Oceangoing LPG Exports Historical U.S. Propane Export Total (MBpd) 1,500 d ) (MBp 1,250 rt 1,000 Exp o 750 ane Pro p 500 . S 250 U . — 2007A 2008A 2009A 2010A 2011A 2012A 2013A 2014A 2015A 2016A 2017A 2018A 2019A 2020A 2021A 2022A AFR ASI AUS CAN CAR EUR LAT Historical U.S. Ethane Export Total (MBpd) 500 (MBpd) 400 Export 300 Ethane 200 . S 100 U . — 2007A 2008A 2009A 2010A 2011A 2012A 2013A 2014A 2015A 2016A 2017A 2018A 2019A 2020A 2021A 2022A AFR ASI AUS CAN CAR EUR LAT Source: RBN Energy 18

Preliminary Draft – Confidential LPG Market Overview LPG Production Growth and Capacity Utilization Terminal Capacity Utilization vs. YoY LPG Production Growth Actual Seaborne Exports 7.0% 3.0 120% 6.1% 6.0% 2.5 100% r ce o u 5.3% S 5.1% by Growth 5.0% 4.7% uction 2.0 80% ro d 4.0% P P G Utiliza L MMBpd tion US 1.5 60% OY (%) Y 3.0% 107% 2.4% 2.0% 1.0 40% 1.9% 2.0% 1.8% 1.7% 70% 64% 58% 58% 66% 68% 61%57% 64% 0.5 20% 1.0% 0.4% 0.2% 0.1% —% -—-% 2022E 2023E 2024E 2025E LPG Production Gas Plants Refinery Utilization Estimate Capacity (MMBpd) Marine Exports (MMBpd) Source: Wall Street Research 19

Preliminary Draft – Confidential LPG Market Overview Historical Pricing of NGLs/LPGs vs. Crude Oil Historical Commodity Prices $1.60 $140.00 Domestic Market $1.40 $120.00 2018A 2019A 2020A 2021A 2022A $1.20 ) $100.00 Ethane $0.32 $0.22 $0.19 $0.31 $0.50 /Gal $1.00 $80.00 W Propane $0.87 $0.54 $0.47 $1.04 $1.19 ( $ TI $0.80 ( Iso-Butane $1.02 $0.71 $0.59 $1.17 $1.49 $ GLs $60.00 /Bb Normal-Butane $1.01 $0.65 $0.57 $1.18 $1.40 N $0.60 ) l $40.00 Natural Gasoline $1.44 $1.14 $0.78 $1.54 $2.01 $0.40 NGLs (Composite) $0.74 $0.51 $0.41 $0.83 $1.06 $0.20 $20.00 Crude Oil (WTI) $64.94 $56.97 $39.37 $68.07 $98.19 $— $--Jan-18 Jan-19 Dec-19 Dec-20 Nov-21 Oct-22 Ethane Propane NGLs (Composite) Crude Oil (WTI) Historical Commodity Prices (% of WTI) 100% $140.00 Domestic Market $120.00 80% 2018A 2019A 2020A 2021A 2022A $100.00 Ethane 20.8% 16.0% 20.2% 19.0% 21.5% 60% Propane 56.5% 40.1% 50.1% 64.5% 51.0% TI $80.00 WTI W ( Iso-Butane 65.7% 52.2% 62.9% 72.5% 63.6% of $ $60.00 % 40% /Bbl) Normal-Butane 65.6% 47.9% 61.0% 72.8% 59.9% $40.00 Natural Gasoline 92.8% 84.2% 83.7% 95.3% 86.1% 20% NGLs (Composite) 48.0% 37.8% 44.1% 51.0% 45.3% $20.00 —% $--Jan-18 Jan-19 Dec-19 Dec-20 Nov-21 Oct-22 Crude Oil (WTI) Ethane Propane NGLs (Composite) Source: FactSet as of October 21, 2022 20

$ 0 $ 1 1 $ $ 0 0 $ 1 $ . . . . . . Note: $ $ Source: — 50 00 50 — 40 80 20 NGL 2022A LPG DCP 2021A $1.17 2021A $0.83 NGL and Historical Historical represents 2022A $1.49 2022A $1.06 Management,—Iso YTD LPG 2022E $1.00 2022E $0.77 Market actual NYMEX Composite 2023E $0.96 Butane 2023E $0.73 Strip ( pricing $ as NYMEX 2024E $0.87 NYMEX 2024E $0.68 of Pricing: Barrel through Strip /Gal) Strip ( October 2025E $0.80 2025E $0.64 $ October 21, Overview /Gal) 20, Pricing 2026E $0.80 Pricing 2026E $0.64 2022 2022 2027E $0.80 2027E $0.64 Historicals whereas vs $ 0 $ 1 1 $ $ 0 0 $ 0 $ . . . . . . . 2022E — $ 50 00 50 — $ 20 40 60 represents 2021A $1.18 2021A $0.31 NYMEX Historical Historical NYMEX 2022A $1.40 2022A $0.50 Normal forward 2022E $0.96—2022E $0.37 Ethane Strip 21 curves 2023E $0.92 Butane 2023E $0.32 ( $ as NYMEX 2024E $0.86 ( NYMEX 2024E $0.29 of $ /Gal) Strip Strip October 2025E $0.80 /Gal) 2025E $0.28 21, 2022 Pricing 2026E $0.75 Pricing 2026E $0.28 through 2027E $0.75 2027E $0.28 YE $ 0 $ 1 $ 2 0 $ $ 1 1 $ . . . . . . 2022 $ — 75 50 25 — $ 50 00 50 Historical 2021A $1.54 Historical 2021A $1.04 2022A $2.01 Natural 2022A $1.19 2022E $1.61 2022E $0.84 Propane 2023E $1.58 2023E $0.81 ( Preliminary Gasoline $ NYMEX 2024E $1.46 ( NYMEX 2024E $0.78 Draft $ Strip Strip /Gal) – 2025E $1.37 /Gal) 2025E $0.74 Pricing 2026E $1.37 Pricing 2026E $0.71 Confidential 2027E $1.37 2027E $0.71

Preliminary Draft – Confidential LPG Market Overview NGL Consensus Pricing Commentary “3Q22 ethane prices of 55c/gal could fall to ~40c/gal in 4Q22/1Q23, with another step-down to 33c/gal in 2Q23+ as Henry Hub/Waha prices slide to $4.94/$2.18 per Mcf in 2Q23…ethane is typically 35-45% of the composite NGL barrel, causing its pricing to have an outsized impact on NGL prices vs. other purity products.” Chase Mulvehill, BofA Securities (October 9, 2022) “Given the significant increase in oil and gas prices driven by a host of factors including: a strong rebound in oil demand as the world emerges from COVID, continued supply-chain issues which are driving inflation, a tight global LNG market, and the Russia/Ukraine conflict, we are materially increasing our NGL price estimates. We’re raising our 2022 and 2023 NGL price estimates to $1.18/g and $1.06/g, respectively, from $0.92/g and $0.82/g. The increase to our NGL price deck reflects higher near-term crude oil and natural gas price estimates from our E&P and refining teams, partially offset by lower assumed LPG-to-Brent ratios.” Michael Blum, Wells Fargo (March 23, 2022) “The NGL-to-WTI and NGL-to-Brent crude oil ratios averaged 52% and 51%, respectively, in February, both of which are below the prior month. NGL prices to a large extent track Brent more closely than WTI, given that a significant portion of overall demand for NGLs is predicated on exports and competition in the global markets (e.g., ethylene derivative and LPG exports).” Praneeth Satish, Wells Fargo (March 23, 2022) “The move up in NGL pricing is driven by higher oil prices, which NGL pricing is tied to. But we are also seeing increasing demand (including exports) for NGLs moving up pricing relative to WTI (a higher % of WTI). Generally speaking, midstreamers with NGL marketing capabilities fare well in a rising price environment.” Robert Hope, Scotiabank (November 16, 2021) Source: Wall Street Research 22

Preliminary Draft – Confidential IV. DCP Financial Projections

Preliminary Draft – Confidential DCP Financial Projections DCP Financial Projections – Assumptions â—¼ï€ The DCP Financial Projections as provided by DCP Management and reviewed by Evercore, incorporate the following assumptions:ï,„ï€ September 23, 2022 price deck as follows: Price Deck 2022E 2023E 2024E 2025E 2026E 2027E NGLs ($/Gal) $1.04 $0.75 $0.66 $0.60 $0.60 $0.60 WTI ($/Bbl) 93.75 73.80 68.04 64.12 61.16 58.81 Henry Hub ($/MMBtu) 7.26 5.56 4.76 4.59 4.52 4.50 ï,„ï€ Interest rates on debt as follows: NGL Composite Pricing • Revolving Credit Facility: Approximately 4.5%-5.5% annually $1.20 Management Forecast • Permanent Debt Average: Approximately 5.5%-6.0% annually $1.06 ï,„ï€ $1.00 $0.95 Preferred Equity redeemed once eligible and financed with debt $0.83 $0.73 and cash flow from operations: $0.80 $0.68 • $500 Series A redeemed in Q3 2022 $0.77 $0.64 $0.64 $0.64 $0.60 $0.75 • $161 Series B redeemed in Q2 2023 $0.66 $0.60 $0.60 $0.60 • $110 Series C redeemed in Q4 2023 $0.40ï,„ï€ Common Units outstanding: $0.20 • 90.6 million publicly held LP Units • 117.8 million DCP LP Units $— ï,„ï€ Quarterly distributions per LP held flat at $0.43/unit throughout A 2021 2022 A E 2022 2023 E 2024 E E 2025 2026 E 2027 E the projection period ï,„ï€ No minimum cash balance Historical NYMEX Strip Pricing (10/21/22) ï,„ï€ Maintenance capital expenditures of $134.7 million per year in 2022E, $150.0 million per year in 2023E and 2024E and $125.0 million per year from 2025E to 2027E ï,„ï€ Growth capital expenditures: • Identified organic capital expenditures of $114.4 million in 2H 2022 • Identified acquisition capital expenditures of $144.0 million in 2H 2022 • Unidentified organic capital expenditures of $125.0 million in 2023E and $50.0 million per year from 2024E to 2027E Source: DCP Management Note: DCP Financial Projections do not include effects of the Proposed Transaction 23

Preliminary Draft – Confidential DCP Financial Projections DCP Financial Projections – Gathering & Processing Segment ($ in millions, except per unit amounts) For the Years Ending December 31, 2022E-2027E 2022E 2023E 2024E 2025E 2026E 2027E CAGR G&P Wellhead Volumes (Mcfd) North Region 1,600 1,639 1,677 1,707 1,707 1,707 1.3% South Region 944 1,034 1,034 1,034 1,034 1,034 1.8% Midcontinent Region 820 806 790 770 770 770 (1.3%) Permian Region 1,019 1,134 1,151 1,162 1,162 1,162 2.7% Total G&P Wellhead Mcfd 4,385 4,613 4,652 4,674 4,674 4,674 1.3% Implied Weighted Average Fees North Region ($ / Mcf) $1.95 $1.44 $1.25 $1.17 $1.15 $1.14 South Region ($ / Mcf) 0.55 0.39 0.36 0.34 0.34 0.34 Midcontinent Region ($ / Mcf) 0.92 0.81 0.78 0.75 0.75 0.74 Permian Region ($ / Mcf) 1.57 1.41 1.33 1.26 1.24 1.23 Gross Margin North Region $1,140 $864 $767 $726 $717 $711 (9.0%) South Region 191 147 137 129 128 127 (7.9%) Midcontinent Region 275 239 225 212 209 207 (5.5%) Permian Region 584 585 562 533 527 522 (2.2%) Other G&P -——————- Total Gathering & Processing Gross Margin $2,190 $1,835 $1,690 $1,601 $1,581 $1,568 (6.5%) Total Costs North Region ($157) ($144) ($154) ($154) ($156) ($158) 0.2% South Region (99) (99) (92) (92) (94) (95) (0.8%) Midcontinent Region (165) (162) (174) (174) (177) (179) 1.6% Permian Region (251) (293) (307) (308) (312) (317) 4.7% Other G&P (19) (23) (20) (21) (21) (21) 2.6% Total Gathering & Processing Costs ($691) ($721) ($748) ($748) ($760) ($771) 2.2% Total Gathering & Processing Segment Margin $1,499 $1,113 $942 $852 $821 $797 (11.9%) Source: DCP Management 24

Preliminary Draft – Confidential DCP Financial Projections DCP Financial Projections – Logistics & Marketing Segment ($ in millions, except per unit amounts) For the Years Ending December 31, 2022E-2027E 2022E 2023E 2024E 2025E 2026E 2027E CAGR NGL Throughput Volumes (MBpd) Southern Hills + Sand Hills 421 435 430 430 430 430 0.4% Other NGL Pipelines 289 288 288 288 288 288 (0.1%) Total NGL Pipelines Throughput (MBpd) 710 722 718 718 718 718 0.2% Implied Weighted Average Fees Southern Hills + Sand Hills ($ / Bbl) $2.79 $2.75 $2.81 $2.86 $2.86 $2.86 Other NGL Pipelines ($ / Bbl) 1.34 1.42 1.48 1.51 1.51 1.51 Gross Margin Southern Hills + Sand Hills $429 $436 $442 $449 $449 $449 0.9% Other NGL Pipelines 141 149 156 158 158 158 2.3% NGL Marketing + Storage 46 49 39 39 39 39 (3.2%) Downstream Fractionation 19 21 21 21 21 21 2.0% Gas Marketing + Other Income 18 13 13 13 13 13 (7.1%) Gas Storage 2 13 12 12 12 12 43.2% Guadalupe 62 48 40 40 40 40 (8.5%) Gulf Coast Express Equity Earnings 66 66 66 66 66 66 (0.0%) Cheyenne Connector Equity Earnings 14 14 14 14 14 14 0.0% Total Logistics & Marketing Gross Margin $798 $810 $804 $812 $812 $812 0.4% Total Costs Logistics & Marketing Costs ($44) ($47) ($41) ($41) ($42) ($42) (0.9%) Total Logistics & Marketing Segment Margin $754 $763 $763 $771 $771 $770 0.4% Source: DCP Management 25

Preliminary Draft – Confidential DCP Financial Projections DCP Financial Projections – Summary Cash Flows ($ in millions, except per unit amounts) For the Years Ending December 31, 2022E-2027E 2022E 2023E 2024E 2025E 2026E 2027E CAGR Gathering & Processing Segment Margin $1,499 $1,113 $942 $852 $821 $797 (11.9%) Logistics & Marketing Segment Margin 754 763 763 771 771 770 0.4% Less: Corporate Costs (255) (257) (236) (236) (239) (243) (1.0%) Plus: Adj. Distribution in Excess of Equity Earnings—Logistics 77 80 80 80 80 80 0.9% Plus: Adj. Distribution in Excess of Equity Earnings—Discovery 13 9 9 9 9 9 (7.3%) Plus: Hedge settlement (339) (11) 2 (4) -—- Adjusted EBITDA $1,749 $1,698 $1,560 $1,473 $1,442 $1,414 (4.2%) Plus: Growth Projects -—- 18 25 32 39 Total Adjusted EBITDA $1,749 $1,698 $1,578 $1,498 $1,474 $1,453 (3.6%) Less: Interest Expense ($273) ($286) ($258) ($221) ($210) ($183) Less: Preferred Securities (58) (15) -———-Less: Sustaining Capital (135) (150) (150) (125) (125) (125) Less: Income Taxes (5) (5) (5) (5) (5) (5) Less: Other (3) (7) (7) (5) (5) (5) Distributable Cash Flow $1,275 $1,235 $1,157 $1,142 $1,128 $1,135 (2.3%) Identified Organic Capital ($140) $— $— $— $— $—Unidentified Organic Capital — (125) (50) (50) (50) (50) Acquisition Capital (160) -————- Distributions (342) (359) (359) (359) (359) (359) 1.0% Working Capital and Interest Timing (30) 133 90 -——- Cash Surplus / (Shortfall) $603 $884 $838 $733 $719 $726 3.8% LP Units Outstanding 208 209 209 209 209 209 0.0% Distributable Cash Flow per LP Unit $6.12 $5.92 $5.55 $5.47 $5.41 $5.44 (2.3%) Distribution per Unit 1.64 1.72 1.72 1.72 1.72 1.72 1.0% Total Distributions $342 $359 $359 $359 $359 $359 1.0% Source: DCP Management 26

Preliminary Draft – Confidential DCP Financial Projections DCP Financial Projections – Sources and Uses ($ in millions) For the Years Ending December 31, 2022E 2023E 2024E 2025E 2026E 2027E Sources DCF Surplus / (Shortfall) $603 $884 $838 $733 $719 $726 Revolver Draw 246 -————- Total Sources $849 $884 $838 $733 $719 $726 Uses Revolver Paydown $— $113 $393 $— $— $—Long-Term Debt Paydown 350 500 — 825 — 500 Preferred Equity Redemption 500 271 -———-Cash Balance Increase / (Decrease) (1) — 445 (92) 719 226 Total Uses $849 $884 $838 $733 $719 $726 Memo: Cash $— $— $445 $353 $1,073 $1,298 Total Debt 5,331 4,718 4,325 3,500 3,500 3,000 Net Debt $5,331 $4,718 $3,880 $3,147 $2,427 $1,702 Preferred Equity 271 -————- Net Debt + Preferred Equity $5,602 $4,718 $3,880 $3,147 $2,427 $1,702 Total Debt / Adjusted EBITDA 3.0x 2.8x 2.7x 2.3x 2.4x 2.1x Net Debt / Adjusted EBITDA 3.0 2.8 2.5 2.1 1.6 1.2 (Net Debt + Preferred Equity) / Adjusted EBITDA 3.2 2.8 2.5 2.1 1.6 1.2 Source: DCP Management 27

Preliminary Draft – Confidential DCP Financial Projections DCP Financial Projections Summary ($ in millions) EBITDA Distributable Cash Flow $1,749 $1,777 $1,762 $1,698 $1,642 $1,662 $1,578 $1,580 $1,616 $1,498 $1,474 $1,453 $1,327 $1,349 $1,275 $1,235 $1,247 $1,283 $1,210 $1,186 $1,157 $1,142 $1,128 $1,135 2022E 2023E 2024E 2025E 2026E 2027E 2022E 2023E 2024E 2025E 2026E 2027E DCP Financial Projections Wall Street Consensus Estimates Distributed Cash Flow Net Debt / EBITDA Coverage Ratio: 3.0x 2.8x 3.6x 3.4x 3.2x 3.2x 3.1x 3.2x 2.5x 2.1x 1.6x 1.2x $350 $359 $359 $359 $359 $359 2022E 2023E 2024E 2025E 2026E 2027E 2022E 2023E 2024E 2025E 2026E 2027E Source: DCP Management; FactSet; as of October 21, 2022 28

Preliminary Draft – Confidential DCP Financial Projections Historical Leverage and Distribution Coverage Historical and Forecasted Leverage (Net Debt / LTM Adjusted EBITDA) 4.7x 4.7x Projected 4.5x 4.2x 3.7x 3.2x 2.9x 3.0x 3.0x 3.0x 2.9x 2.8x 2.7x 2.6x 2.5x 2.5x 2.4x 2.3x 2.2x 2.1x 2.0x 1.9x 1.8x 1.6x 1.6x 1.4x 1.3x 1.2x Q1 Q2 Q3 Q4 Q1 Q2 Q3 Q4 Q1 Q2 Q3 Q4 Q1 Q2 Q3 Q4 Q1 Q2 Q3 Q4 Q1 Q2 Q3 Q4 Q1 Q2 Q3 Q4 2021 2022 2023 2024 2025 2026 2027 Historical and Forecasted Distribution Coverage (Distributable Cash Flow per LP Unit / Distribution per LP Unit) 4.5x Projected 4.1x 3.6x 3.6x 3.7x 3.4x 3.3x 3.3x 3.3x 3.3x 3.2x 3.2x 3.2x 3.1x 3.2x 3.2x 3.1x 3.2x 3.2x 3.1x 3.1x 3.0x 3.1x 3.1x 2.8x 2.7x 2.7x 2.2x Q1 Q2 Q3 Q4 Q1 Q2 Q3 Q4 Q1 Q2 Q3 Q4 Q1 Q2 Q3 Q4 Q1 Q2 Q3 Q4 Q1 Q2 Q3 Q4 Q1 Q2 Q3 Q4 2021 2022 2023 2024 2025 2026 2027 Source: Public filings, DCP Management 29

Preliminary Draft – Confidential V. Preliminary Valuation of the Common Units

Preliminary Draft – Confidential Preliminary Valuation of the Common Units Potential Valuation Methodologies Evercore utilized the following methodologies to analyze the value of the Common Units: Methodology Description Assumptions / Detail Values the Common Units based on the concept of Projected cash flow discounted to 12/31/22 the time value of money Utilizes varying weighted average cost of capital EBITDA exit multiple based on peer group trading multiples and Discounted (“WACC”) discount rates and applies various precedent transaction multiples Cash Flow perpetuity growth rates to derive after-tax valuation WACC based on the Capital Asset Pricing Model (“CAPM”) Analysis ranges Calculated terminal values based on a range of multiples of EBITDA and assumed perpetuity growth rates Values the Common Units based on the present value Projected distributions discounted to 12/31/22 of the future cash distributions Discounted Terminal yield range based on the distribution yield at which DCP Distributions has traded over the last 52 weeks Analysis Cost of equity based on CAPM and total expected market return for MLPs and companies with similar assets to those of DCP Values the Common Units based on EV/EBITDA and EV/EBITDA multiples applied to 2023E and 2024E EBITDA Peer Group Price/DCF trading multiples Price/DCF LP unit applied to 2023E and 2024E DCF/LP unit Trading Multiples selected based on EV/EBITDA and Analysis Price/DCF multiples of MLPs and companies with assets similar to those owned by DCP Precedent Values the Common Units based on multiples of EV/EBITDA multiples applied to 2022E EBITDA M&A transaction value to EBITDA in historical transactions involving assets similar to those owned by DCP Transaction Analysis For Premiums Values DCP common units based on historical Median 1-Day spot and 20-Day volume weighted average price Reference premiums paid in (i) MLP buy-ins and (ii) MLP mergers (“VWAP”) premiums paid applied to relevant unit prices Only Paid Analysis since 2018 30

Preliminary Draft – Confidential Preliminary Valuation of the Common Units Preliminary Valuation Summary For Reference Only Peer Group Discounted Cash Flow Analysis Discounted Distributions Analysis Precedent M&A Trading Analysis MLP Premiums Analyst Price Transaction Paid Targets Perpetuity Price/DCF Analysis Exit Multiple CAPM Market Return EV/EBITDA Growth per LP Unit $60.00 Implied range based on 5% annual distribution growth through 2027E $50.34 $50.00 $46.04 $45.00 $44.37 $44.05 $42.19 $41.61 $40.00 $37.57 $36.93 $39.96 Current Price $39.391 $38.00 $33.54 $35.20 $32.22 Proposed Consideration $34.75 $33.65 $32.13 $30.00 $30.50 $29.14 $29.60 $25.65 $26.08 $25.10 $20.00 8.0%—9.0% WACC 4.0%—5.0% Terminal Yield 8.0x—9.0x 6.5x—7.5x 11.0%—13.0% 10.0%—12.0% Equity Cost of 2023E EBITDA 2023E DCF/LP Unit Median Merger 0.5%—1.5% 7.25x—9.25x Analyst Price 8.25x—9.25x Equity Cost of Premium: Perpetuity Growth Capital Based on 2022E EBITDA Targets Exit Multiple Capital Based on 7.5x—8.5x 5.5x—6.5x 15.0%—30.0% Rate Total Expected CAPM 2024E EBITDA 2024E DCF/LP Unit Market Return Note: Sensitivity case using a 5% annual distribution growth rate which assumes lower than the commodity super cycle board assumption of 7.5% growth and management 0% growth scenarios 1. As of October 21, 2022 31

Preliminary Draft – Confidential Preliminary Valuation of the Common Units Five-Year Discounted Cash Flow Analysis ($ in millions, except per unit amounts) Summary Results For the Years Ending December 31, Exit Perpetuity 2023E 2024E 2025E 2026E 2027E Multiple Growth Adjusted EBITDA $1,698 $1,578 $1,498 $1,474 $1,453 $1,453 $1,453 Less: Tax Depreciation and Amortization¹ (13,110) (154) (127) (118) (116) (125) EBIT ($11,412) $1,424 $1,371 $1,356 $1,338 $1,328 Less: Cash Taxes — (84) (81) (80) (79) (491) EBIAT ($11,412) $1,340 $1,290 $1,275 $1,258 $837 Plus: Tax Depreciation and Amortization 13,110 154 127 118 116 125 Less: Maintenance Capex (150) (150) (125) (125) (125) (125) Less: Growth Capex (125) (50) (50) (50) (50) (50) Unlevered Free Cash Flow $1,423 $1,293 $1,242 $1,219 $1,199 $787 EBITDA Multiple / Perpetuity Growth Rate 8.75x 1.0% Implied Terminal Value $12,714 $10,594 Present Value of Terminal Value @ 8.5% Discount Rate $8,455 $6,764 Plus: Present Value of Unlevered Free Cash Flow @ 8.5% Discount Rate 5,270 Implied Enterprise Value $13,725 $12,033 Less: Preferred Equity2 ($271) Less: Net Debt2 (5,331) Less: Noncontrolling Interests2 (25) Implied Equity Value $8,098 $6,406 DCP Units Outstanding3 210 Implied Value per Unit $38.63 $30.56 Sensitivity Analysis Terminal Exit Multiple Perpetuity Growth Rate 7.75x 8.25x 8.75x 9.25x 9.75x —% 0.5% 1.0% 1.5% 2.0% 7.5% $36.24 $38.66 $41.07 $43.48 $45.90 7.5% $32.44 $35.02 $38.00 $41.47 $45.58 ACC 8.0% 35.12 37.47 39.83 42.19 44.55 8.0% 29.28 31.49 34.01 36.93 40.33 W 8.5% 34.02 36.32 38.63 40.93 43.24 WACC 8.5% 26.48 28.39 30.56 33.03 35.89 9.0% 32.95 35.20 37.45 39.70 41.96 9.0% 23.99 25.65 27.53 29.65 32.07 9.5% 31.90 34.10 36.31 38.51 40.71 9.5% 21.76 23.22 24.85 26.68 28.76 32 1. 2023E tax DD&A assumes 80% bonus depreciation calculated as the midpoint of the enterprise value range plus 2023E capital expenditures 2. Per DCP Management as of December 31, 2022 3. Includes 117.8mm common units held by DCP Midstream, LLC and DCP Midstream GP, LP, and 1.3mm phantom and performance units

Preliminary Draft – Confidential Preliminary Valuation of the Common Units Discounted Distribution Analysis For the Years Ending December 31, Terminal Value 2023E 2024E 2025E 2026E 2027E Low High DCP Distribution per Unit (Cash, As Paid) $1.72 $1.72 $1.72 $1.72 $1.72 $1.72 – $1.72 Terminal Yield1 5.0% 4.0% Terminal Value $34.40 $43.00 Equity Cost of Capital Based on CAPM Present Value @ 9.0% Cost of Equity $29.34 – $34.93 Present Value @ 10.0% Cost of Equity 28.20 – 33.54 Present Value @ 11.0% Cost of Equity 27.11 – 32.22 Present Value @ 12.0% Cost of Equity 26.08 – 30.96 Present Value @ 13.0% Cost of Equity 25.10 – 29.77 Implied DCP Unit Value – Based on CAPM $26.08 – $33.54 Equity Cost of Capital Based on Total Expected Market Return2,3 Present Value @ 10.0% Cost of Equity $28.20 – $33.54 Present Value @ 11.0% Cost of Equity 27.11 – 32.22 Present Value @ 12.0% Cost of Equity 26.08 – 30.96 Present Value @ 13.0% Cost of Equity 25.10 – 29.77 Present Value @ 14.0% Cost of Equity 24.17 – 28.64 Implied DCP Unit Value – Based on Total Expected Market Return $25.10 – $32.22 Source: DCP Management 1. Based on DCP’s 52-week yield range of 4.0% to 5.6% with a median of 4.5% and mean of 4.5%; Current yield is 4.4% as of October 21, 2022 2. Detail on Equity Cost of Capital calculations in Appendix 3. Assumes terminal year distribution grows 2.5%—3.5% in low and high terminal values, respectively, in line with Wall St estimates 33

Preliminary Draft – Confidential Preliminary Valuation of the Common Units Discounted Distribution Analysis – 5% Annual Distribution Growth For Reference Only For the Years Ending December 31, Terminal Value 2023E 2024E 2025E 2026E 2027E Low High DCP Distribution per Unit (Cash, As Paid) $1.72 $1.81 $1.90 $1.99 $2.09 $2.09 – $2.09 Distribution Growth 5.0% 5.0% 5.0% 5.0% Terminal Yield1 5.0% 4.0% Terminal Value $41.80 $52.25 Equity Cost of Capital Based on CAPM Present Value @ 8.0% Cost of Equity $36.27 – $43.39 Present Value @ 9.0% Cost of Equity 34.82 – 41.61 Present Value @ 10.0% Cost of Equity 33.44 – 39.93 Present Value @ 11.0% Cost of Equity 32.13 – 38.33 Present Value @ 12.0% Cost of Equity 30.89 – 36.82 Implied DCP Unit Value – Based on CAPM $32.13 – $41.61 Equity Cost of Capital Based on Total Expected Market Return2,3 Present Value @ 10.5% Cost of Equity $32.78 – $39.12 Present Value @ 11.5% Cost of Equity 31.50 – 37.57 Present Value @ 12.5% Cost of Equity 30.29 – 36.09 Present Value @ 13.5% Cost of Equity 29.14 – 34.69 Present Value @ 14.5% Cost of Equity 28.05 – 33.36 Implied DCP Unit Value – Based on Total Expected Market Return $29.14 – $37.57 Source: DCP Management Note: Sensitivity case using a 5% annual distribution growth rate which assumes lower than the commodity super cycle board assumption of 7.5% growth and management 0% growth scenarios 1. Based on DCP’s 52-week yield range of 4.0% to 5.6% with a median of 4.5% and mean of 4.5%; Current yield is 4.4% as of October 21, 2022 2. Detail on Equity Cost of Capital calculations in Appendix 3. Assumes terminal year distribution grows 2.5%—3.5% in low and high terminal values, respectively, in line with Wall St estimates 34

Preliminary Draft – Confidential Preliminary Valuation of the Common Units Peer Group Trading Analysis ($ in millions, except per unit/share amounts) Price/DCF Price Equity Enterprise Enterprise Value/EBITDA / CAFD per Share Distribution Yield Dist. Net Debt / Parthership / Company 10/21/22 Value Value 2022E 2023E 2024E 2023E 2024E Current 2023E Growth 2022E EBITDA Gathering & Processing MLPs/Companies Antero Midstream Corporation $10.31 $4,990 $8,375 9.5x 8.9x 8.4x 8.7x 8.3x 8.7% 8.7% NM 3.8x Crestwood Equity Partners LP 30.30 3,744 7,886 9.6 8.4 7.9 5.4 5.2 8.6% 8.9% 5.0% 3.8 DT Midstream, Inc. 56.16 5,501 8,913 10.8 9.4 8.8 8.8 8.3 4.6% 4.8% 5.0% 4.0 EnLink Midstream, LLC 11.06 5,438 11,664 9.2 8.8 8.7 5.5 5.5 4.1% 4.4% 10.0% 3.6 Equitrans Midstream Corporation 8.09 3,539 11,026 10.3 10.2 8.8 7.9 5.9 7.4% 7.4% 2.4% 5.9 Hess Midstream Partners LP 27.25 6,540 9,475 9.7 8.9 8.4 7.6 NM 8.2% 8.6% 4.0% 3.0 Kinetik Holdings Inc. 34.96 4,720 8,207 9.9 9.1 8.1 6.4 5.6 8.6% 9.0% 4.3% 4.2 ONEOK, Inc. 56.60 25,392 39,025 10.8 10.1 9.8 10.5 9.9 6.6% 6.6% 3.0% 3.8 Summit Midstream Partners, LP 18.57 195 1,918 8.9 5.6 6.8 NM NM —% —% NM 7.1 Targa Resources Corp. 67.79 15,667 28,830 9.0 8.9 8.3 6.8 6.4 2.1% 2.3% 5.0% 3.4 Western Midstream Partners, LP 28.11 10,931 17,703 8.1 7.9 7.7 6.6 6.1 7.1% 7.1% 11.2% 3.1 Mean 9.6x 8.7x 8.3x 7.4x 6.8x 6.0% 6.2% 5.5% 4.1x Median 9.6 8.9 8.4 7.2 6.1 7.1% 7.1% 5.0% 3.8 DCP Midstream, LP (Consensus) $39.39 $8,258 $14,313 8.1x 8.1x 8.7x 6.2x 6.6x 4.4% 4.6% 3.1% 3.0x DCP Midstream, LP (DCP Financial Projections) $39.39 $8,258 $14,313 8.2x 8.4x 9.1x 6.7x 7.1x 4.4% 4.4% —% 2.9x Source: Company filings, FactSet, Wall Street Research; as of October 21, 2022 35

Preliminary Draft – Confidential Preliminary Valuation of the Common Units Peer Group Trading Analysis – EV/EBITDA ($ in millions, except per unit amounts) 2023E EBITDA $1,698 Relevant EBITDA Multiple 8.0x—9.0x Implied Enterprise Value Based on 2023E EBITDA $13,582—$15,280 Less: Preferred Equity1 (271) Less: Net Debt1 (5,331) Less: Noncontrolling Interests1 (25) Implied Equity Value $7,955—$9,652 DCP Units Outstanding 210 Implied DCP Unit Price Range—2023E EBITDA $37.94—$46.04 2024E EBITDA $1,578 Relevant EBITDA Multiple 7.5x—8.5x Implied Enterprise Value Based on 2024E EBITDA $11,832—$13,410 Less: Preferred Equity1 (271) Less: Net Debt1 (5,331) Less: Noncontrolling Interests1 (25) Implied Equity Value $6,205—$7,783 DCP Units Outstanding 210 Implied DCP Unit Price Range—2024E EBITDA $29.60—$37.12 Implied DCP Unit Price Range—2023E and 2024E EBITDA $29.60—$46.04 1. As of December 31, 2022 36
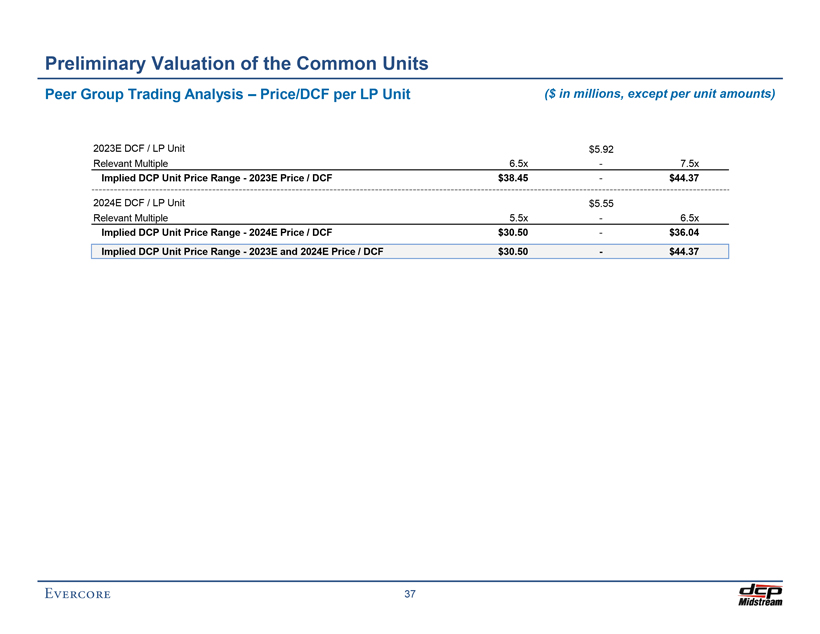
Preliminary Draft – Confidential Preliminary Valuation of the Common Units Peer Group Trading Analysis – Price/DCF per LP Unit ($ in millions, except per unit amounts) 2023E DCF / LP Unit $5.92 Relevant Multiple 6.5x—7.5x Implied DCP Unit Price Range—2023E Price / DCF $38.45—$44.37 2024E DCF / LP Unit $5.55 Relevant Multiple 5.5x—6.5x Implied DCP Unit Price Range—2024E Price / DCF $30.50—$36.04 Implied DCP Unit Price Range—2023E and 2024E Price / DCF $30.50—$44.37 37

Preliminary Draft – Confidential Preliminary Valuation of the Common Units Precedent M&A Transaction Analysis ($ in millions, except per unit amounts) Gathering & Processing Transactions Date Transaction EBITDA Announced Acquiror / Target (Seller) Value ($MM) Multiple Sep-22 Antero Midstream / Marcellus G&P System (Crestwood Equity Partners) $205 7.0x Jun-22 Targa Resources / Lucid Energy 3,550 7.5 Jun-22 DCP Midstream / James Lake System (Woodland Midstream II) 160 5.5 May-22 EnLink Midstream / Barnett Gathering and Processing System (Crestwood Equity Partners) 275 4.0 May-22 Crestwood Equity Partners / Sendero Midstream 600 7.0 Apr-22 Delek Logistics Partners / 3Bear Energy 625 8.8 Mar-22 Targa Resources / Southcross Energy Operating 200 4.0 Mar-22 Williams Companies / Trace Midstream 950 6.0 Jan-22 Enterprise Products Partners / Navitas Midstream Partners 3,250 7.8 Oct-21 Crestwood Equity Partners / Oasis Midstream 1,848 8.3 Oct-21 Altus Midstream / BCP Raptor/EagleClaw Midstream 6,248 11.7 Apr-21 EnLink Midstream LLC / Amarillo Rattler JV (Rattler Midstream Partners LP, Amarillo Midstream) 60 6.0 Aug-20 Citizen Energy II LLC / Blue Mountain Midstream LLC (Riviera Resources, Inc.) 111 7.1 Jul-20 CNX Resources Corporation / 46.9% stake in CNX Midstream Partners LP 728 7.7 Feb-20 Equitrans Midstream Corporation / EQM Midstream Partners 1,762 8.3 Mean 7.1x Median 7.1 Min 4.0 Max 11.7 Source: Public filings, FactSet 38

Preliminary Draft – Confidential Preliminary Valuation of the Common Units Precedent M&A Transaction Analysis (cont’d) ($ in millions, except per unit amounts) Natural Gas Transportation Transactions Date Transaction EBITDA Announced Acquiror / Target (Seller) Value ($MM) Multiple Sep-22 DT Midstream / 26.25% Ownership Interest in Millennium Pipeline (National Grid) $552 10.0x Jun-21 Kinder Morgan / Stagecoach Gas Services (Crestwood Equity Partners LP, Consolidated Edison Inc) 857 10.7 Feb-21 ArcLight Capital Partners LLC / 25% Interest in Natural Gas Pipeline Company of America LLC (Kinder Morgan) 1,300 11.2 Jul-20 Berkshire Hathaway Energy / Dominion Energy Natural Gas Transmission and Storage Business 9,700 9.7 Mar-20 ATCO Gas and Pipelines Ltd / Pioneer Pipeline (Tidewater Midstream and Infrastructure Ltd. & TransAlta Corp.) 184 NA Feb-20 Equitrans Midstream Corporation / EQM Midstream Partners, LP 1,762 8.3 Sep-19 NextEra Energy Partners, LP / Meade Pipeline Co LLC 1,280 11.6 Sep-19 Kinder Morgan / Corpus Christi Pipeline Network (Southcross) 76 9.0 Jan-19 NEXUS Gas Transmission, LLC (Enbridge Inc.; DTE Energy Company) / Generation Pipeline LLC 160 14.4 Feb-18 Tallgrass Energy GP, LP / 25.01% interest in Rockies Express Pipeline LLC (Tallgrass Development LP) 1,044 6.4 Nov-17 American Midstream Partners, LP / Trans-Union Interstate Pipeline (ArcLight Capital Partners, LLC) 48 6.5 Jul-17 Blackstone Energy Partners / 32.44% interest in Rover Pipeline (Energy Transfer Partners, LP) 1,571 10.7 TC Pipelines / 49.3% interest in Iroquois Gas Transmission System, LP and 11.8% interest in Portland Natural Gas Transmission (TransCanada Jun-17 765 10.9 Corp.) Apr-17 Tallgrass Energy Partners, LP / 24.99% interest in Rockies Express Pipeline LLC (Tallgrass Development, LP) 1,043 6.6 Mean 9.7x Median 10.0 Min 6.4 Max 14.4 Source: Public filings, FactSet 39

Preliminary Draft – Confidential Preliminary Valuation of the Common Units Precedent M&A Transaction Analysis (cont’d) ($ in millions, except per unit amounts) NGL and NGL-Related Transportation Transactions Date Transaction EBITDA Announced Acquiror / Target (Seller) Value ($MM) Multiple Mar-22 ArcLight / 25% Interest in Gulf Coast Express Pipeline (Targa Resources) $857 11.1x Oct-21 Phillips 66 / Phillips 66 Partners 14,400 10.1 Aug-19 Pembina Pipeline Corporation / Cochin Pipeline (Kinder Morgan) 1,546 13.0 Jul-19 Altus Midstream / 33.0% interest in Shin Oak Pipeline (Enterprise Products Partners L.P.) 1,336 13.8 Oct-17 Blackstone Energy Partners / 25% interest in Grand Prix Pipeline (Targa Resources Corp) 325 10.0 Oct-16 Phillips 66 Partners LP / 30 crude oil, refined products and NGL logistics assets (Phillips 66) 1,300 8.7 Jun-16 Riverstone Investment Group LLC / 50% Partner Interest in Utopia Pipeline Project (Kinder Morgan, Inc.) 300 12.0 May-16 Phillips 66 Partners LP / Standish Pipeline and remaining 75% in Phillips 66 Sweeny Frac LLC (Phillips 66) 1,033 8.6 Mean 10.9x Median 10.6 Min 8.6 Max 13.8 Source: Public filings, FactSet 40

Preliminary Draft – Confidential Preliminary Valuation of the Common Units Precedent M&A Transaction Analysis – EV/EBITDA ($ in millions, except per unit amounts) 2022E EBITDA $1,749 Relevant EBITDA Multiple 7.25x—9.25x Implied Enterprise Value Based on 2022E EBITDA $12,682—$16,180 Less: Preferred Equity1 (271) Less: Net Debt1 (5,331) Less: Noncontrolling Interests1 (25) Implied Equity Value $7,055—$10,553 DCP Units Outstanding 210 Implied DCP Unit Price Range—2022E EBITDA $33.65—$50.34 1. As of December 31, 2022 41

Preliminary Draft – Confidential Preliminary Valuation of the Common Units Premiums Paid Analysis ($ in millions, except per unit amounts) Premium1 Date 1-Day 20-Day Announced Acquiror / Target Consideration Prior Spot VWAP 07/28/22 PBF Energy, Inc. / PBF Logistics LP Cash/Stock-for-Unit (3.0%) 9.5% 07/25/22 Shell USA, Inc. / Shell Midstream Partners, L.P. Cash-for-Unit 23.0% 23.6% 06/02/22 Hartree Partners, LP / Sprague Resources LP Cash-for-Unit 25.2% 27.0% 05/25/22 Höegh LNG Holdings Ltd / Höegh LNG Partners LP Cash-for-Unit 35.0% 42.2% 05/16/22 Diamondback Energy / Rattler Midstream LP Stock-for-Unit 17.3% 10.3% 04/22/22 Ergon, Inc. / Blueknight Energy Partners, L.P. Cash-for-Unit 51.5% 47.5% 12/20/21 BP p.l.c / BP Midstream Partners LP Stock-for-Unit 10.8% 4.0% 10/27/21 Phillips 66 / Phillips 66 Partners LP Stock-for-Unit 4.8% 6.7% 10/04/21 Stonepeak Infrastructure Partners / Teekay LNG Partners LP Cash-for-Unit 8.3% 5.3% 08/23/21 Landmark Dividend / Landmark Infrastructure Partners LP Cash-for-Unit 38.4% 35.0% 03/05/21 Chevron Corporation / Noble Midstream Partners LP Stock-for-Unit 16.7% 18.0% 12/15/20 TC Energy Corporation / TC PipeLines, LP Stock-for-Unit 19.5% 15.5% 07/27/20 CNX Resources Corporation / CNX Midstream Partners Stock-for-Unit 28.1% 3.9% 02/27/20 Equitrans Midstream Corporation / EQM Midstream Partners, LP Stock-for-Unit (1.5%) (5.6%) 12/17/19 Blackstone Infrastructure Partners / Tallgrass Energy LP Cash-for-Unit 56.4% 33.9% 10/01/19 Brookfield Business Partners L.P. / Teekay Offshore Partners L.P. Cash-for-Unit 28.1% 15.1% 09/16/19 Energy Transfer LP / SemGroup Corporation Cash/Unit-for-Share 65.4% 87.3% 08/21/19 Pembina Pipeline Corporation / Kinder Morgan Canada Limited Share-for-Share 37.7% 34.7% 05/10/19 IFM Investors / Buckeye Partners, L.P. Cash-for-Unit 27.5% 23.8% 05/08/19 MPLX LP / Andeavor (Marathon Petroleum Corporation; Andeavor Logistics LP) Unit-for-Unit 1.8% 1.3% 04/02/19 UGI Corporation / AmeriGas Partners, L.P. Cash/Stock-for-Unit 13.5% 22.2% 03/18/19 ArcLight Energy Partners Fund V, L.P. / American Midstream, LP Cash-for-Unit 31.2% 31.2% 02/05/19 SunCoke Energy, Inc. / SunCoke Energy Partners, L.P. Stock-for-Unit 9.3% 19.5% 11/26/18 ArcLight Energy Partners Fund VI, L.P. / TransMontaigne Partners L.P. Cash-for-Unit 12.6% 9.2% 11/08/18 Western Gas Equity Partners, LP / Western Gas Partners, LP Unit-for-Unit 7.6% 62.4% 10/22/18 EnLink Midstream, LLC / EnLink Midstream Partners, LP Unit-for-Unit 1.1% (0.5%) 10/18/18 Valero Energy Corporation / Valero Energy Partners LP Cash-for-Unit 6.0% 9.4% 10/09/18 Antero Midstream GP LP / Antero Midstream Partners LP Cash/Stock-for-Unit 63.7% 54.6% Min (3.0%) (5.6%) Median 18.4% 18.8% All Transactions Mean 22.7% 23.1% Max 65.4% 87.3% Min 6.0% 5.3% Median 27.8% 25.4% Cash-for-Unit Mean 28.6% 25.3% Max 56.4% 47.5% Source: Bloomberg, FactSet, Public filings 1. VWAP premiums paid are calculated by dividing the value of the offer, defined as the exchange ratio multiplied by the closing price of the acquiror’s shares / units on the last trading day prior to announcement plus any cash received, by the 20-trading day VWAP of the target as calculated from the last undisturbed trading day prior to the announcement 42

Preliminary Draft – Confidential Preliminary Valuation of the Common Units Premiums Paid Analysis (cont’d) ($ in millions, except
per unit amounts) For Reference Only Summary Results – Cash-for-Unit Transactions 1-Day Prior Spot 20-Day VWAP Share Price as of 8/17/22 $34.75 $33.88 Historical Merger Premium Range 6.0% — 56.4% 5.3% — 47.5% Implied DCP Unit Price Range $36.84 — $54.36 $35.67 — $49.97 Merger Premium Selected
Range 15.0% 30.0% Median-Implied DCP Unit Value $39.96 $44.05 Source: FactSet 43

Preliminary Draft – Confidential VI. Next Steps and Follow-Up

Preliminary Draft – Confidential Next Steps and Follow-Up Diligence Update â—¼ï€ Completed model and financial diligence call on October 24, 2022 with DCP Management, [PSX Management] and Barclaysï,„ï€ To discuss preliminary observations â—¼ï€ Having recently received a limited data set, Evercore has not yet prepared sensitivity analyses for the Special Committee, but will be prepared to do so in the next set of materials Analysis Detail Commentary â—¼ï€ The DCP Financial Projections assume NYMEX forward curve â—¼ï€ DCP’s exposure to pricing as of September 23, 2022, as per DCP Management commodity price provides upside in Commodity Price â—¼ï€ Evercore to discuss price sensitivity case with the committee higher commodity Sensitivity price environmentsï,„ï€ Sensitivity case at this commodity price deck will subsequently eted be requested by Evercore—Compl â—¼ï€ The Proposed Transaction triggers a tax liability for the Unaffiliated â—¼ï€ To be discussed Be—Unitholders with the Conflicts To Committee and Tax Analysisï,„ï€ Sale will pull forward a future tax liability and eliminate upside presented in future Diligence participation in future growth materials â—¼ï€ Evercore has requested information to perform a tax impact analysis ional Addit â—¼ï€ PSX estimates operational synergies can be achieved through the â—¼ï€ To be discussed Proposed Transaction with the Conflicts Synergy Committee and â—¼ï€ Evercore to evaluate and analyze such synergies presented in future Valuation materials 44

Preliminary Draft – Confidential Appendix

Preliminary Draft – Confidential Appendix Preliminary Draft – Confidential A. Weighted Average Cost of Capital Analysis

Preliminary Draft – Confidential Weighted Average Cost of Capital Analysis DCP Common Units – Capital Asset Pricing Model ($ in millions, except per unit/share amounts) Unit/Share Price Market Equity Total Debt and Total Debt / Adjusted Unlevered 1 2 Partnership/Corporation 10/21/22 Value Preferred Equity Total Capitalization Beta Beta Antero Midstream Corporation $10.31 $4,990 $3,386 40.4% 0.84 0.54 Crestwood Equity Partners LP 30.30 3,744 3,617 49.1% 0.56 0.33 EnLink Midstream, LLC 11.06 5,438 4,555 45.6% 1.05 0.63 Equitrans Midstream Corporation 8.09 3,539 7,110 66.8% 0.88 0.34 Hess Midstream Partners LP 27.25 6,540 2,957 31.1% 0.67 0.51 Kinetik Holdings Inc. 34.96 4,720 3,492 42.5% 2.20 1.39 CAPM ONEOK, Inc. 56.60 25,392 13,769 35.2% 0.99 0.69 Summit Midstream Partners, LP 18.57 195 1,730 89.9% 1.12 0.15 Targa Resources Corp. 67.79 15,667 11,011 41.3% 0.99 0.64 Western Midstream Partners, LP 28.11 10,931 6,725 38.1% 0.94 0.66 Mean 48.0% 1.02 0.59 Median 41.9% 0.96 0.59 DCP Midstream, LP $39.39 $8,258 $6,038 42.2% 0.84 0.55 Risk-free Rate 3 4.5% Unlevered Beta 0.55 Debt and Preferred / Total Capitalization 42.2% Adjusted Levered Equity Beta 0.84 Supply-Side MRP Historical MRP DCP Midstream Cost of Debt7 WACC Market Risk Premium (“MRP”) 4 6.2% 7.5% Small Company Risk Premium 5 0.7% Yield-to-Worst Equity Cost of Capital 6 10.5% 11.5% DCP Midstream 5.600% Senior Notes Due 2044 6.99% Pre-Tax Cost of Debt 7 7.2% U.S. Treasury Note Due 2042 4.54% After-Tax Cost of Debt 8 5.0% Less: U.S. Treasury Note Due 2044 4.37% WACC 8.2% 8.8% 0.18% DCP Midstream Implied 20-Year Cost of Debt 7.17% Equity Cost of Capital Sensitivity WACC Sensitivity (Supply-Side / Historical) (Supply-Side / Historical) Debt and Preferred / Total Capitalization Debt and Preferred / Total Capitalization 45.0% 50.0% 55.0% 60.0% 65.0% 45.0% 50.0% 55.0% 60.0% 65.0% 0.45 7.6% / 8.1% 7.5% / 8.0% 7.5% / 7.9% 7.4% / 7.9% 7.4% / 7.8% 0.45 9.7% / 10.5% 10.0% / 11.0% 10.5% / 11.5% 11.0% / 12.2% 11.7% / 13.0% 0.50 7.9% / 8.4% 7.8% / 8.3% 7.7% / 8.3% 7.7% / 8.2% 7.6% / 8.1% 0.50 10.2% / 11.1% 10.5% / 11.6% 11.0% / 12.2% 11.6% / 12.9% 12.4% / 13.9% Beta 0.55 8.1% / 8.7% 8.1% / 8.6% 8.0% / 8.6% 7.9% / 8.5% 7.9% / 8.4% Beta 0.55 10.6% / 11.7% 11.1% / 12.2% 11.6% / 12.9% 12.3% / 13.7% 13.1% / 14.7% Unlevered 0.60 8.4% / 9.0% 8.3% / 9.0% 8.3% / 8.9% 8.2% / 8.8% 8.1% / 8.7% Unlevered 0.60 11.1% / 12.3% 11.6% / 12.9% 12.2% / 13.6% 12.9% / 14.5% 13.9% / 15.6% 0.65 8.7% / 9.4% 8.6% / 9.3% 8.5% / 9.2% 8.5% / 9.1% 8.4% / 9.0% 0.65 11.6% / 12.9% 12.1% / 13.5% 12.8% / 14.3% 13.6% / 15.2% 14.6% / 16.4% 1. Source: Predicted raw betas from FactSet; Adjusted Equity Beta calculated as: (0.67) × Raw Beta +(0.33) × 1.0 2. Unlevered Beta calculated as: Adjusted Equity Beta × (E/(E + D × (1-T)); Assumes corporate tax rate of 29.6% for partnerships and 21.0% for corporations 3. 20-year Treasury as of October 21, 2022 4. Source: Duff & Phelps 5. Decile: Mid Cap (5) with equity value range of $6,743.4 million to $13,177.8 million 6. Equity Cost of Capital calculated as: Risk-free rate + (Levered Equity Beta × Market Risk Premium) + Small Company Risk Premium 7. Implied DCP 20-year cost of debt based on the yield-to-worst of DCP’s 5.600% Senior Notes Due 2044 adjusted for 20-year maturity using the implied yield spread from relevant U.S. treasury notes 8. Assumes U.S. individual partnership income tax structure through 2025 of 80.0% of income taxable at highest tax rate of 37.0%, or 29.6% 45

Preliminary Draft – Confidential Weighted Average Cost of Capital Analysis DCP Common Units – Total Expected Market Return ($ in millions, except per unit/share amounts) Unit/Share Price Market Equity Distribution/Dividend Total Partnership/Corporation 10/21/22 Value Current Yield Growth Return Antero Midstream Corporation $10.31 $4,990 8.7% —% 8.7% Crestwood Equity Partners LP 30.30 3,744 8.6% 5.0% 13.6% EnLink Midstream, LLC 11.06 5,438 4.1% 10.0% 14.1% Equitrans Midstream Corporation 8.09 3,539 7.4% 2.4% 9.8% Total Hess Midstream Partners LP 27.25 6,540 8.2% 4.0% 12.2% Expected Kinetik Holdings Inc. 34.96 4,720 8.6% 4.3% 12.9% Market ONEOK, Inc. 56.60 25,392 6.6% 3.0% 9.6% Return Targa Resources Corp. 67.79 15,667 2.1% 5.0% 7.0% Western Midstream Partners, LP 28.11 10,931 7.1% 11.2% 18.3% Mean 11.8% Median 12.2% DCP Midstream, LP $39.39 $8,258 4.4% 3.1% 7.5% WACC Debt and Preferred / Total Capitalization 42.2% Market Required Equity Return 12.2% WACC Pre-Tax Cost of Debt1 7.2% After-Tax Cost of Debt2 5.0% WACC 9.2% DCP Cost of Debt1 Yield-to-Worst DCP Midstream 5.600% Senior Notes Due 2044 6.99% U.S. Treasury Note Due 2042 4.54% Less: U.S. Treasury Note Due 2044 4.37% 0.18% DCP Midstream Implied 20-Year Cost of Debt 7.17% 1. Implied DCP 20-year cost of debt based on the yield-to-worst of DCP’s 5.600% Senior Notes Due 2044 Adjusted for 20-year maturity using the implied yield spread from relevant U.S. treasury notes 2. Assumes U.S. individual partnership income tax structure through 2025 of 80.0% of income taxable at highest tax rate of 37.0%, or 29.6% 46
Exhibit (c)(3)

Exhibit (c)(3)
Preliminary Draft – Confidential Discussion Materials Prepared for the Special Committee of the Board of Directors of DCP Midstream GP, LLC November 2, 2022

Preliminary Draft – Confidential These materials have been prepared by Evercore Group L.L.C. (“Evercore”) for the Special Committee (the “Special Committee”) of the Board of Directors of DCP Midstream GP, LLC, the general partner of DCP Midstream, LP (“DCP” or the “Partnership”) to whom such materials are directly addressed and delivered and may not be used or relied upon for any purpose other than as specifically contemplated. These materials are based on information provided by or on behalf of the Partnership and/or other potential transaction participants, from public sources or otherwise reviewed by Evercore. Evercore assumes no responsibility for independent investigation or verification of such information and has relied on such information being complete and accurate in all material respects. To the extent such information includes estimates and forecasts of future financial performance prepared by or reviewed with the management of the Partnership and/or other potential transaction participants or obtained from public sources, Evercore has assumed that such estimates and forecasts have been reasonably prepared on bases reflecting the best currently available estimates and judgments of such management (or, with respect to estimates and forecasts obtained from public sources, represent reasonable estimates). No representation or warranty, express or implied, is made as to the accuracy or completeness of such information and nothing contained herein is, or shall be relied upon as, a representation, whether as to the past, the present or the future. These materials were designed for use by specific persons familiar with the business and affairs of the Partnership. These materials are not intended to provide the sole basis for evaluating, and should not be considered a recommendation with respect to, any transaction or other matter. These materials have been developed by and are proprietary to Evercore and were prepared exclusively for the benefit and internal use of the Special Committee. These materials were compiled on a confidential basis for use of the Special Committee in evaluating the potential transaction described herein and not with a view to public disclosure or filing thereof under state or federal securities laws, and may not be reproduced, disseminated, quoted or referred to, in whole or in part, without the prior written consent of Evercore. These materials do not constitute an offer or solicitation to sell or purchase any securities and are not a commitment by Evercore (or any affiliate) to provide or arrange any financing for any transaction or to purchase any security in connection therewith. Evercore assumes no obligation to update or otherwise revise these materials. These materials may not reflect information known to other professionals in other business areas of Evercore and its affiliates. Evercore and its affiliates do not provide legal, accounting or tax advice. Accordingly, any statements contained herein as to tax matters were neither written nor intended by Evercore or its affiliates to be used and cannot be used by any taxpayer for the purpose of avoiding tax penalties that may be imposed on such taxpayer. Each person should seek legal, accounting and tax advice based on his, her or its particular circumstances from independent advisors regarding the impact of the transactions or matters described herein.

Table of Contents Section Executive Summary I DCP Situation Analysis II LPG Market Overview III DCP Financial Projections IV Preliminary Valuation of the Common Units V Illustrative DCP Unitholder Tax Analysis VI Appendix A. Weighted Average Cost of Capital Analysis B. Supplemental Valuation Materials

Preliminary Draft – Confidential I. Executive Summary

Preliminary Draft – Confidential Executive Summary Introduction and Overview of Materials â—¼ï€ Evercore Group L.L.C. (“Evercore”) is pleased to provide the following materials to the Special Committee of the Board of DCP Midstream GP, LLC (the “Special Committee”), the general partner of DCP Midstream LP (“DCP” or the “Partnership”), regarding the proposed acquisition by Phillips 66 and its affiliates (collectively, “PSX,” “Phillips 66” or the “Company”) of all of the outstanding common units (the “Common Units”) of the Partnership not already owned by Phillips 66, Enbridge, Inc. (“ENB”) and their affiliates (the “Unaffiliated Unitholders”), for cash (the “Proposed Transaction” or “Project Dynamo”) ï,„ï€ PSX, ENB and their affiliates currently own 117,762,526 DCP Common Units1 • 56.5% of the total outstanding common units ï,„ï€ PSX has proposed to acquire each outstanding DCP common unit at a value equal to $34.75 as of August 17, 2022 (the “Proposed Consideration”) in an all-cash transaction • Implies an at market offer as of August 17, 2022 A â—¼ï€ The Evercore analysis reviews valuation in terms of absolute unit price for DCP based on the financial projections for DCP as provided by DCP management (the “DCP Financial Projections”) as well as sensitivities based on certain price decks including: ï,„ï€ B A sensitivity case utilizing NYMEX Strip Pricing as of October 26, 2022 ï,„ï€ C A sensitivity case based on assumed pricing higher than that utilized in the DCP Financial Projections ï,„ï€ D A sensitivity case based on assumed pricing lower than that utilized in the DCP Financial Projections Source: DCP Management, FactSet 1. As of 8/26/22 1

Pretiliminary Draft – Confidential Executive Summary Overview of the Transaction Counterparty â—¼ï€ Phillips 66 (NYSE: PSX) â—¼ï€ PSX to acquire 100% of the Common Units owned by the Unaffiliated Unitholders Transaction Summary â—¼ï€ DCP will cease to be a publicly-traded partnership Proposed â—¼ï€ $34.75 in cash per Common Unit Consideration â—¼ï€ Approval of the Special Committee and the board of directors of the general partner of DCP Timing and Approvals â—¼ï€ Regulatory filing requirements to be confirmed â—¼ï€ The Proposed Transaction is taxable to the Unaffiliated Unitholders resulting in the realization of taxes Other on deferred income and capital gains 2

Preliminary Draft – Confidential Executive Summary Summary Organizational Structure and Transaction Economics ($ in millions, except per unit amounts) Current Ownership Structure (As-Converted) Sources and Uses Sources Cash $3,149 Total Sources $3,149 Economic Interests Economic Interests Uses Units (mm) Price 43.31% DCP Midstream, LP 13.20% DCP Midstream, LP Public Common Units (mm) 91 $34.75 $3,149 Total Uses $3,149 Transaction Economics DCP Midstream, LLC (Merged JV) Proposed Consideration $34.75 Phillips 66 oversees and manages DCP Common Units Outstanding1,2 (mm) 210 100.00% GP, 56.51% LP Total Equity Value $7,285 Plus: Preferred Equity @ 12/31/22 271 Plus: DCP Net Debt @ 12/31/22 5,331 DCP Midstream, LP (NYSE:DCP) Plus: Noncontrolling Interests 25 Common Market Capitalization1,2: $8,281 Total Implied Enterprise Value $12,912 Preferred Equity: $751 Net Debt: $5,279 Implied EV/EBITDA (DCP Financial Projection Metric Multiple Enterprise Value: $14,336 2022E $1,749 7.4x 2023E 1,698 7.6 Implied EV/EBITDA (Wall Street Consensus Estimates) Public Unitholders 2022E $1,776 7.3x 90,622,632 Common Units 43.49% Public Interest 2023E 1,751 7.4 Interests to be acquired in the Proposed Transaction Source: DCP Management, FactSet, Wall St Research; Proposed transaction Sources and Uses assumes 12/31 balance sheet date per management model 1. As of October 28, 2022; Includes 117.8mm common units held by DCP Midstream, LLC and DCP Midstream GP, LP | 2. Includes 1.3mm phantom and performance units 3

Preliminary Draft – Confidential Executive Summary DCP Common Unit Price Prior to the Unaffected Date of August 17, 2022 Premium at Unaffected Date DCP Price Relative to Historical Average Proposed Consideration $34.75 YTD 2022 Average $32.39 7.3% Last 20 Trading Days Average $33.80 2.8% Last 30 Trading Days Average $32.46 7.0% Last 60 Trading Days Average $32.79 6.0% Last 6 Months Average $33.13 4.9% Last 12 Months Average $30.88 12.5% $40.00 $39.50 Proposed Consideration $34.75 $35.00 $30.00 $25.00 Offer Date: $20.00 8/17/22 $15.00 1/1/21 5/14/21 9/24/21 2/4/22 6/17/22 10/28/22 Historical Price (DCP) Proposed Consideration YTD 2022 Average Last 20 Trading Days Average Last 30 Trading Days Average Last 60 Trading Days Average Last 6 Months Average Last 12 Months Average Source: FactSet; as of October 28, 2022 4

Preliminary Draft – Confidential Executive Summary Analysis at Various Prices For Reference Only Implied Premium to: EV / EBITDA1 Implied Premium to: DCP Price August 17 Price 10-Day VWAP2 of 20-Day VWAP2 of 30-Day VWAP2 of October 28 Price per Unit $34.75 $34.46 $33.88 $32.49 2022E 2023E $39.50 $34.75 —% 0.8% 2.6% 6.9% 7.4x 7.6x (12.0%) 35.00 0.7% 1.6% 3.3% 7.7% 7.4 7.6 (11.4%) 36.00 3.6% 4.5% 6.2% 10.8% 7.5 7.8 (8.9%) 37.00 6.5% 7.4% 9.2% 13.9% 7.7 7.9 (6.3%) 38.00 9.4% 10.3% 12.1% 16.9% 7.8 8.0 (3.8%) 39.00 12.2% 13.2% 15.1% 20.0% 7.9 8.1 (1.3%) 40.00 15.1% 16.1% 18.1% 23.1% 8.0 8.3 1.3% 41.00 18.0% 19.0% 21.0% 26.2% 8.1 8.4 3.8% 42.00 20.9% 21.9% 24.0% 29.3% 8.3 8.5 6.3% 43.00 23.7% 24.8% 26.9% 32.3% 8.4 8.6 8.9% 44.00 26.6% 27.7% 29.9% 35.4% 8.5 8.7 11.4% 45.00 29.5% 30.6% 32.8% 38.5% 8.6 8.9 13.9% 46.00 32.4% 33.5% 35.8% 41.6% 8.7 9.0 16.5% 47.00 35.3% 36.4% 38.7% 44.6% 8.8 9.1 19.0% 48.00 38.1% 39.3% 41.7% 47.7% 9.0 9.2 21.5% 49.00 41.0% 42.2% 44.6% 50.8% 9.1 9.4 24.1% 50.00 43.9% 45.1% 47.6% 53.9% 9.2 9.5 26.6% 51.00 46.8% 48.0% 50.5% 57.0% 9.3 9.6 29.1% 52.00 49.6% 50.9% 53.5% 60.0% 9.4 9.7 31.6% 53.00 52.5% 53.8% 56.4% 63.1% 9.6 9.9 34.2% Source: DCP filings, FactSet; as of October 28, 2022 1. EBITDA based on the DCP Financial Projections; Enterprise Value assumes balance sheet items as of December 31, 2022 per management model 2. Based on August 17, 2022 unaffected price date 5

Preliminary Draft – Confidential Executive Summary Side-by-Side Analysis ($ in millions, except per unit / share amounts) DCP PSX Total Units Outstanding1 210 Fully-Diluted Shares Outstanding 486 Common Unit Price $39.50 Common Share Price $104.20 Total Equity Value $8,281 Total Equity Value $50,614 Plus: Preferred Equity 751 Plus: Net Debt 10,160 Plus: Net Debt 5,279 Plus: Noncontrolling Interest 297 Plus: Noncontrolling Interest 25 Enterprise Value $61,071 Enterprise Value $14,336 DCP Financial Projections Consensus Data Consensus Data Metric Yield/Multiple Metric Yield/Multiple Metric Yield/Multiple EV/EBITDA EV/EBITDA 2022E $1,749 8.2x $1,776 8.1x 2022E $13,137 4.6x 2023E 1,698 8.4 1,751 8.2 2023E 9,659 6.3 2024E 1,578 9.1 1,642 8.7 2024E 8,376 7.3 P / DCF per LP Unit P / FCFPS 2022E $6.12 6.5x $6.47 6.1x 2022E $16.13 6.5x 2023E 5.92 6.7 6.97 5.7 2023E 11.48 9.1 2024E 5.55 7.1 5.96 6.6 2024E 8.83 11.8 Distribution Yield Dividend Yield Current $1.72 4.4% $1.72 4.4% Current $3.88 3.7% 2023E 1.72 4.4% 1.80 4.6% 2023E 3.94 3.8% 2024E 1.72 4.4% 1.89 4.8% 2024E 4.15 4.0% Distribution Coverage 2022E $6.12 3.7x $6.47 3.8x 2023E 5.92 3.4 6.97 3.9 2024E 5.55 3.2 5.96 3.2 Note: As of October 28, 2022; Balance sheet data per Partnership / Company filings as of June 30, 2022; DCP debt pro forma for James Lake system acquisition Source: FactSet, company filings, DCP Management 1. Includes 117.8mm common units held by DCP Midstream, LLC and DCP Midstream GP, LP, and 1.3mm phantom and performance units 6

Preliminary Draft – Confidential II. DCP Situation Analysis

Preliminary Draft – Confidential DCP Situation Analysis Partnership Overview Description Asset Map â—¼ï€ DCP is a Delaware limited partnership formed to own and operate a diversified portfolio of midstream energy assets â—¼ï€ Two reportable segments: Logistics and Marketing; Gathering and Processing ï,„ï€ Logistics and Marketing includes fractionating NGLs as well as transporting, trading, marketing and storing natural gas and NGLs ï,„ï€ Gathering and Processing includes gathering, compressing, treating, and processing natural gas, as well as producing and fractionating NGLs and recovering condensate â—¼ï€ Credit rating: Ba1 (Moody’s); BBB+ (S&P) Volumes By Segment (Q2’22) NGL Pipeline Volume and Utilization Q2’22 Avg. Q2’22 Pipeline (MBbls/d) Throughput Utilization Sand Hills 304 91% Southern Hills 122 95% Front Range 78 90% Texas Express 23 62% Other 193 62% Total 720 80% G&P Volume and Utilization Q2’22 Avg. Q2’22 Plant (MMcf/d) Wellhead Vol. Utilization North 1,578 100% Midcontinent 838 75% Permian 982 89% South 985 60% Total 4,383 81% 7 Source: DCP 2Q’22 Investor Presentation

Preliminary Draft – Confidential DCP Situation Analysis Logistics and Marketing Overview Logistics & Marketing segment is fee-based or fee-like and includes NGL and gas takeaway pipelines, marketing, trading, storage and fractionators % Ownership / DCP Logistics Assets Segment Description Operated â—¼ï€ Sand Hills provides NGL takeaway / Cheyenne Connector from the Permian and Eagle Ford to 67% ï¡ â—¼ï€ Operated by Tallgrass the Gulf Coast â—¼ï€ DCP 50% Owner â—¼ï€ Southern Hills provides NGL 67% / ï¡ï€ takeaway from the DJ Basin and the NGL Midcontinent to Gulf Coast markets Takeaway â—¼ï€ Front Range / Texas Express provide NGL takeaway from the DJ 33% / 10% / Basinï² â–º Both operated by Enterprise Southern Hills Products Partners L.P. (“EPD”) Front Range â—¼ï€ DCP 67% owner â—¼ï€ Operated by EPD â—¼ï€ Gulf Coast Express provides ~2.0 25% / ï² â—¼ï€ DCP 33% owner Bcf/d gas takeaway from the Texas Express Permian to the Gulf Coast â—¼ï€ Operated by EPD Gulf Coast Express â—¼ï€ DCP 10% Owner â–º Operated by Kinder Morgan, â—¼ï€ Operated by KMI Inc. (“KMI”) â—¼ï€ DCP 25% owner â—¼ï€ Guadalupe provides 245 MMcf/d Gas 50% / ï²ï€ gas takeaway from the Permian Takeaway â—¼ï€ Cheyenne Connector provides 600 Mont Belvieu 50% / ï² MMcf/d gas takeaway from the DJ â—¼ï€ DCP 12.5% owner Basin to the Rockies Express in the Enterprise fractionator Pipeline â—¼ï€ DCP 20% owner in â–º Operated by Tallgrass Energy Mont Belvieu 1 Partners, LP (“Tallgrass”) fractionator â—¼ï€ 12 Bcf Spindletop natural gas 100% / ï¡ï€ storage facility in SE Texas Legend: Gas & NGL â—¼ï€ 8 MMBbls Marysville NGL storage Storage 100% / ï¡ DCP operated facility in Michigan Third party operated â—¼ï€ Equity ownership of 56 MBpd of Guadalupe Market Hub 12.5% / 20% / Mont Belvieu fractionation â—¼ï€ Waha to New Braunfels 50%/50% DCP/EPD Sand Hillsï²ï€ NGL or Natural Fractionation capacity â—¼ï€ New Braunfels to Dewville 100% DCP â—¼ï€ DCP 67% owner Gas Pipeline â—¼ï€ Additional field fractionation â—¼ï€ Dewville to Katy 50%/50% DCP/ETC Katy â—¼ï€ Katy Header 100% DCP capacity of 70 MBpd 8

Preliminary Draft – Confidential DCP Situation Analysis Gathering and Processing Overview North Assets Permian Assets South Assets Midcontinent Assets / James Lake Asset type Fractionator & Plant Natural Gas Plant NGL Pipeline Natural Gas Pipeline DJ Basin Delaware Basin Eagle Ford SCOOP/STACK â—¼ï€ 10 active plants â—¼ï€ 4 active plants â—¼ï€ 4 active plants â—¼ï€ 5 active plants â—¼ï€ 1,160 MMcf/d capacity â—¼ï€ 640 MMcf/d capacity â—¼ï€ 690 MMcf/d capacity â—¼ï€ 560 MMcf/d capacity â—¼ï€ ~3,000 miles of gathering â—¼ï€ ~6,700 miles of gathering â—¼ï€ ~5,000 miles of gathering â—¼ï€ ~10,000 miles of gathering Michigan/Collbran Midland Basin/Other East Texas Liberal/Panhandle â—¼ï€ 3 active treaters â—¼ï€ 7 active plants â—¼ï€ 1 active plant â—¼ï€ 1 active plant â—¼ï€ 420 MMcf/d capacity â—¼ï€ 700 MMcf/d capacity â—¼ï€ 400 MMcf/d capacity â—¼ï€ 550 MMcf/d capacity â—¼ï€ ~500 miles of gathering â—¼ï€ ~8,700 miles of gathering â—¼ï€ ~1,000 miles of gathering â—¼ï€ ~13,500 miles of gathering Select Customers Select Customers Gulf Coast/Other Select Customers â—¼ï€ 2 active plants â—¼ï€ 540 MMcf/d capacity â—¼ï€ ~1000 miles of gathering Select Customers Note: Number of active processing plants and active plant capacity excludes idled plants and includes DCP’s proportionate ownership share of capacity. Delaware Basin includes recently acquired James Lake System 9

Preliminary Draft – Confidential DCP Situation Analysis DCP Organizational Structure Economic Interests Economic Interests 43.31% DCP Midstream, LP 13.20% DCP Midstream, LP 6.50% Gray Oak Pipeline, LLC 58.50% Gray Oak Pipeline, LLC DCP Midstream, LLC (Merged JV) Phillips 66 oversees and manages DCP GP and LP interests Enbridge oversees and manages GOP interest Public Other JV Unitholders Partners 43.49% LP 100.00% GP 56.51% LP 65.00% 35.00% Source: Public filings 10

Preliminary Draft – Confidential DCP Situation Analysis ($ in millions, except per unit amounts) Market Capitalization Balance Sheet and Credit Data As of October 28, 2022 As of June 30, 2022 Total Units Outstanding1 210 Cash and Marketable Securities $8 Common Unit Price $39.50 Short-Term Debt 505 Total Equity Value $8,281 Long-Term Debt2 4,782 Plus: Preferred Equity 751 Total Debt $5,287 Plus: Net Debt 5,279 Net Debt $5,279 Plus: Noncontrolling Interest 25 Plus: Noncontrolling Interest 25 Enterprise Value $14,336 Plus: Preferred Equity 751 Plus: Partners’ Capital 5,374 DCP Financial Projections Consensus Data Metric Yield/Multiple Metric Yield/Multiple Net Book Capitalization $11,429 Distribution Yield Revolver Availability / Total Revolver Capacity2 $1,220 / $1,400 Current $1.72 4.4% $1.72 4.4% Net Debt / Net Book Cap 46.2% 2022E 1.64 4.2% 1.68 4.3% Net Debt / 2022E EBITDA 3.0x 2023E 1.72 4.4% 1.80 4.6% Net Debt / 2023E EBITDA 3.0 EV/EBITDA 2022E $1,749 8.2x $1,776 8.1x 2023E 1,698 8.4 1,751 8.2 2024E 1,578 9.1 1,642 8.7 Unit Price and Distribution $45.00 $2.50 D Proposed Consideration: $34.75 istributi Price $30.00 $2.00 on Unitper $15.00 $1.50 Un t i $— $1.00 10/28/20 2/26/21 6/28/21 10/28/21 2/26/22 6/28/22 10/28/22 Distribution per Unit Unit Price Source: DCP filings, FactSet as of October 28, 2022 1. Includes 117.8mm common units held by DCP Midstream, LLC and DCP Midstream GP, LP, and 1.3mm phantom and performance units 2. Pro forma for the $160mm James Lake System acquisition from Woodland Midstream II 11

$1.68 RBC Wells Stifel Source: Mizuho $1.68 DCP Raymond $1.64 DCP FactSet, Fargo Firm $1.68 James Wall 2022E public Raymond $1.62 filings; $1.68 . J as $1.72 Street . R of James Elvira Michael Gabriel Selman Situation October 2022E $1.84 $1.81 Distribution Scotto Blum Akyol Weston 28, 2022 $1.82 Per Moreen Analyst Stifel 2023E $1.75 Research $1.79 Unit Summary $1.80 Analysis $1.72 Date Price 8/17/22 8/25/22 9/14/22 10/14/22 10/18/22 NA Estimates Mizuho $1.93 Low: High: Mean: Targets $2.02 Median: 2024E $1.80 Hold Buy Buy Buy Buy NA $1.89 Recommendation Wells $1.72 12 Fargo 2023E Target $1,750 38 45 43 45 $ 38 45 45 45 $ 45 $1,776 00 . . 00 . 60 00 . . 00 00 . 00 . 00 . . 00 Price $1,804 RBC 2022E $1,805 $1,822 $1,776 $1,749 $ ( $1,750 in FactSet $1,750 $1,773 EBITDA $1,773 Analyst 2023E 80% Buy $2,012 millions, Consensus $1,751 $1,698 Estimates except 2024E Preliminary NA per $1,642 20% Hold Draft $1,665 unit – 2024E $1,638 Recommendations Management NA $1,642 $1,578 amounts) Confidential

Preliminary Draft – Confidential DCP Situation Analysis Analyst Price Targets and Comparison of Valuation Methodologies Price Target Date Broker Valuation Methodology Based on a blend of: (1) a three-stage distribution/dividend discount model, which assumes a 10% required rate of return and a long-term decline rate of -1.0%; (2) a three-stage discounted free cash flow analysis using a discount $45.00 25-Aug-22 rate of 8.1% and a long-term decline rate of -1.0%; and (3) a sum-of-the-parts valuation based on WF’s 2023 forecast $38 price target using PSX’s $34.75 offer price and adding a 10% premium, based on some previous transactions $38.00 17-Aug-22 in the space. The $38 price target represents an overall EV/EBITDA of ~6.9x and a target yield of 4.3% off of RBC’s one-year-out annualized distribution estimate $45.00 14-Oct-22 Derived by applying a 9.0x multiple to Stifel’s 2023 EBITDA estimate of $1.75 billion Blended valuation based on: (1) a 10-year, three-stage distribution/dividend discount model; (2) forward free cash $45.00 18-Oct-22 flow yield relative to comparable industry peers; and (3) forward enterprise value-to-EBITDA multiples relative to comparable industry peers Premium / 13.9% (Discount) 13.9% (3.8%) 13.9% to Current $45.00 $45.00 $45.00 Current Unit Price¹: $39.50 $38.00 Proposed Consideration: $34.75 Source: Wall Street research, FactSet 1. Unit price as of October 28, 2022 13

Preliminary Draft – Confidential DCP Situation Analysis Ratings Agency Commentary The credit profile is now closely tied to PSX and agencies anticipate continued debt reduction Current Ratings Senior Unsecured BBB+ Senior Unsecured Ba1 Outlook Stable Outlook Positive Analyst Mike Llanos Analyst James Wilkins Recent Comments S&P’s Credit Opinion: August 18, 2022 Moody’s Credit Opinion: August 19, 2022 â—¼ï€ The stable outlook reflects expectation that Phillips 66 will fully â—¼ï€ Expects credit metrics will continue to improve and be integrate DCP’s assets into its midstream operations while the supportive of an investment grade rating as free cash flow partnership maintains S&P Global Ratings-adjusted leverage continues to be applied towards debt reduction of less than 4x over the intermediate term â—¼ï€ Credit challenges include exposure to regulatory risk for DJ â—¼ï€ The partnership is 70% fee-based allowing it to capitalize on Basin operations in the state of Colorado and uncertainty the above-average commodity price, however this level of regarding longer term demand for hydrocarbons direct commodity price exposure makes the partnership more susceptible to cash flow volatility What could prompt an UPGRADE: What could prompt an UPGRADE:ï,„ï€ EBITDA continues to grow ï,„ï€ Would only raise rating on DCP if they raise rating on ï,„ï€ Debt to EBITDA is maintained below 4.0x on a sustained Phillips 66 basisï,„ï€ Could raise PSX rating if non-refining segments account ï,„ï€ Distribution coverage remains above 1.3x for much larger share of future consolidated EBITDA, What could prompt a DOWNGRADE: which would mitigate cash flow volatility of its refining assetsï,„ï€ Debt to EBITDA exceeds 4.5x What could prompt a DOWNGRADE:ï,„ï€ Distribution coverage falls below 1.0x ï,„ï€ If Phillips 66’s adjusted debt to EBITDA consistently exceeds 3.0x Source: Standard & Poor’s Rating Services and Moody’s 14

Preliminary Draft – Confidential DCP Situation Analysis DCP Midstream, LP Common Unit Ownership Summary Top 20 Institutional Unit Holders Unit Ownership Breakdown Rank Investor Type Units (000’s) % of Total 1 ALPS Advisors, Inc. Investment Adviser 13,204 6.3% 2 Tortoise Capital Advisors LLC Investment Adviser 9,174 4.4% 3 Harvest Fund Advisors LLC Investment Adviser 8,125 3.9% 4 Goldman Sachs Asset Management LP Investment Adviser 4,691 2.3% Institutional 5 Chickasaw Capital Management LLC Investment Adviser 3,136 1.5% PSX and ENB 35% Owned 6 JPMorgan Securities LLC Investment Adviser 3,132 1.5% Common Units 56% 7 ClearBridge Investments LLC Investment Adviser 2,292 1.1% 8 RR Advisors LLC Hedge Fund Manager 2,085 1.0% 9 Global X Management Co. LLC Investment Adviser 2,056 1.0% 10 Invesco Advisers, Inc. Investment Adviser 2,003 1.0% Retail 11 Barclays Bank Plc Private Banking/Wealth Mgmt 1,615 0.8% 8% Insiders 1% 12 Energy Income Partners LLC Investment Adviser 1,478 0.7% 13 Jennison Associates LLC Mutual Fund Manager 1,250 0.6% 14 First Trust Advisors LP Investment Adviser 1,090 0.5% 15 UBS Securities LLC Broker 1,037 0.5% Unit Ownership Summary 16 Wells Fargo Bank, NA Private Banking/Wealth Mgmt 977 0.5% Holder Units (000’s) Ownership % 17 Infrastructure Capital Advisors LLC Investment Adviser 960 0.5% Institutional 72,814 34.9% 18 DWS Investments (UK) Ltd. Hedge Fund Manager 898 0.4% Insiders 1,581 0.8% 19 Eagle Global Advisors LLC Private Banking/Wealth Mgmt 880 0.4% Retail 16,228 7.8% 20 Salient Capital Advisors LLC Investment Adviser 847 0.4% Total Common Units Outstanding 90,623 43.5% Remainder 11,883 5.7% Plus: PSX and ENB Owned Common Units 117,763 56.5% Total Institutional Ownership 72,814 34.9% Total Units Outstanding1 208,385 100.0% Source: Wall Street research, FactSet; as of October 28, 2022 1. Excludes 1.3mm phantom and performance units 15

Preliminary Draft – Confidential III. LPG Market Overview

Preliminary Draft – Confidential LPG Market Overview Overview Gulf Coast LPG Export Market â—¼ï€ Global Demand: Significant and persistent global demand Permian Basin NGL Pipelines to Gulf Coast Market for LPGs is primarily driven by Asian markets, which lack both local petroleum feedstock and local refining and/or 3,700 processing infrastructure 3,200 â—¼ï€ U.S. Surplus: Rapid growth in U.S. domestic oil and gas 2,700 production has resulted in LPGs exceeding domestic MBpd demand with domestic demand for LPGs remaining relatively 2,200 flat over the past two decades and projected to remain 1,700 relatively flat over the near-to-medium term 1,200 â—¼ï€ Gulf Coast Infrastructure: Several major expansions of Q4 Q1 Q2 Q3 Q4 Q1 Q2 Q3 Q4 Q1 Q2 Q3 Q4 Q1 Q2 Q3 Q4 LPG export capacity are underway to accommodate the 2018 2019 2020 2021 2022E anticipated long-term eastward flows of global LPG trade Existing Capacity Sand Hills Shin Oak â—¼ï€ Fungibility: DCP delivers significant NGL volumes primarily Grand Prix West TX LPG EPIC NGL Lone Star NGL Express to Mont Belvieu, the primary hub for both domestic and exported LPGs U.S. Domestic LPG Supply and Demand Balance 4.00 3.58 — 3.58 3.64 — 3.64 3.41 (0.03) 3.38 0.63 0.63 3.00 0.62 (MMBpd) 1.79 1.78 1.79 e 2.00 n c ala 2.79 2.96 3.01 b 1.00 1.85 LPG 1.59 1.80 US —Production Stocks Demand Production Stocks Demand Production Stocks Demand 2022E 2023E 2024E Gas plant Refinery Exports Domestic demand Source: Wall Street Research 16

Preliminary Draft – Confidential LPG Market Overview Texas Fractionation Overview Texas NGL Fractionation Capacity 5,500 5,000 4,500 MBpd 4,000 3,500 ` 3,000 Q1 Q2 Q3 Q4 Q1 Q2 Q3 Q4 Q1 Q2 Q3 Q4 Q1 Q2 Q3 Q4 Q1 Q2 Q3 Q4 2019 2020 2021 2022E 2023E Existing Capacity Energy Transfer ONEOK Enterprise Targa EPIC Philips 66 U.S. Gulf Coast Capacity Additions 350 300 300 250 200 150 125 150 150 150 125 150 150 110 110 110 110 Bp d 100 M 50 —Energy Targa Frac 6 ONEOK Frac4 Enterprise Energy Targa Frac 7 Enterprise Targa Frac 8 ONEOK Frac5 EPIC Frac 1 Phillips 66 Phillips 66 Transfer Frac Frac 10 Transfer Frac Frac 11 Frac 2&3 6 7 Q1 Q2 Q1 Q3 Q3 Q3 Q3 Q4 2019 2019 2020 2023E 2020 2020 2022E Mont Belvieu Corpus Christi Sweeny Source: Wall Street Research 17

Preliminary Draft – Confidential LPG Market Overview U.S. LPG Oceangoing LPG Exports Historical U.S. Propane Export Total (MBpd) 1,500 d ) (MBp 1,250 rt 1,000 Exp o 750 ane Pro p 500 . S 250 U . — 2007A 2008A 2009A 2010A 2011A 2012A 2013A 2014A 2015A 2016A 2017A 2018A 2019A 2020A 2021A 2022A AFR ASI AUS CAN CAR EUR LAT Historical U.S. Ethane Export Total (MBpd) 500 (MBpd) 400 Export 300 Ethane 200 . S 100 U . — 2007A 2008A 2009A 2010A 2011A 2012A 2013A 2014A 2015A 2016A 2017A 2018A 2019A 2020A 2021A 2022A AFR ASI AUS CAN CAR EUR LAT Source: RBN Energy 18
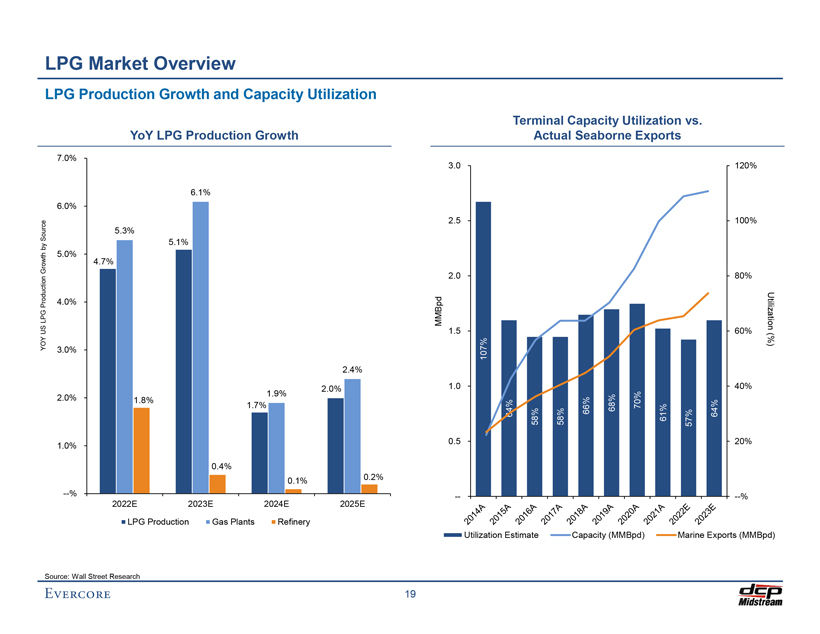
Preliminary Draft – Confidential LPG Market Overview LPG Production Growth and Capacity Utilization Terminal Capacity Utilization vs. YoY LPG Production Growth Actual Seaborne Exports 7.0% 3.0 120% 6.1% 6.0% 2.5 100% r ce o u 5.3% S 5.1% by Growth 5.0% 4.7% uction 2.0 80% ro d 4.0% P P G Utiliza L MMBpd tion US 1.5 60% OY (%) Y 3.0% 107% 2.4% 2.0% 1.0 40% 1.9% 2.0% 1.8% 1.7% 70% 64% 58% 58% 66% 68% 61% 57% 64% 0.5 20% 1.0% 0.4% 0.2% 0.1% —% -—-% 2022E 2023E 2024E 2025E LPG Production Gas Plants Refinery Utilization Estimate Capacity (MMBpd) Marine Exports (MMBpd) Source: Wall Street Research 19

Preliminary Draft – Confidential LPG Market Overview LPG Export Supply Growth Primary Sources Middle East LPG Exports (m tonnes) U.S. LPG Exports (m tonnes) 2 60 8 49 1 1 48 1 3 43 2021A 2022E 2023E 2024E 2024E 2021A 2022E 2023E 2024E 2024E Source: Wall Street Research 20

Preliminary Draft – Confidential LPG Market Overview Historical Pricing of NGLs/LPGs vs. Crude Oil Historical Commodity Prices $1.60 $140.00 Domestic Market $1.40 $120.00 $1.20 2018A 2019A 2020A 2021A 2022A ) $100.00 /Gal $1.00 W Ethane $0.32 $0.22 $0.19 $0.31 $0.50 $ $80.00 TI Propane $0.87 $0.54 $0.47 $1.04 $1.18 ( ( $0.80 $ $60.00 Iso-Butane $1.02 $0.71 $0.59 $1.17 $1.48 NGLs $0.60 /Bbl) $40.00 Normal-Butane $1.01 $0.65 $0.57 $1.18 $1.39 $0.40 Natural Gasoline $1.44 $1.14 $0.78 $1.54 $2.00 $0.20 $20.00 NGLs (Composite) $0.74 $0.51 $0.41 $0.83 $1.05 Crude Oil (WTI) $64.94 $56.97 $39.37 $68.07 $97.94 $— $--Jan-18 Jan-19 Dec-19 Dec-20 Nov-21 Oct-22 Ethane Propane NGLs (Composite) Crude Oil (WTI) Historical Commodity Prices (% of WTI) 100% $140.00 $120.00 Domestic Market 80% $100.00 2018A 2019A 2020A 2021A 2022A Ethane 20.8% 16.0% 20.2% 19.0% 21.4% 60% WT TI $80.00 I Propane 56.5% 40.1% 50.1% 64.5% 50.8% W ( $ of $60.00 Iso-Butane 65.7% 52.2% 62.9% 72.5% 63.3% 40% /Bbl % ) Normal-Butane 65.6% 47.9% 61.0% 72.8% 59.6% $40.00 Natural Gasoline 92.8% 84.2% 83.7% 95.3% 86.0% 20% $20.00 NGLs (Composite) 48.0% 37.8% 44.1% 51.0% 45.1% —% $--Jan-18 Jan-19 Dec-19 Dec-20 Nov-21 Oct-22 Ethane Propane NGLs (Composite) Crude Oil (WTI) Source: FactSet as of October 28, 2022 21

$ 0 $ 1 1 $ $ 0 0 $ 1 $ . . . . . . Note: — $ 50 00 50 — $ 40 80 20 Source: NGL 2022A LPG DCP 2021A $1.17 2021A $0.83 NGL and represents Historical 2022A $1.48 Historical 2022A $1.05 Management,—Iso YTD LPG 2022E $1.05 2022E $0.80 Market actual NYMEX Composite 2023E $1.02 Butane 2023E $0.76 Strip ( pricing $ as of NYMEX 2024E $0.93 NYMEX 2024E $0.71 Pricing: Barrel through Strip /Gal) Strip ( $ October 2025E $0.85 2025E $0.67 October 28, Overview /Gal) 28, 2026E $0.85 2026E $0.66 2022 2022 Pricing Pricing 2027E $0.85 2027E $0.66 Historicals vs whereas $ $ $ $ $ $ 0 1 1 0 0 0. . . . . . . 2022E — $ 50 00 50 — $ 20 40 60 represents 2021A $1.18 2021A $0.31 NYMEX Historical Historical NYMEX 2022A $1.39 2022A $0.50 Normal forward 2022E $1.01—2022E $0.38 Ethane Strip 22 curves 2023E $0.97 Butane 2023E $0.31 ( $ as NYMEX ( NYMEX 2024E of 2024E $0.92 $ $0.29 /Gal) Strip Strip October 2025E $0.86 /Gal) 2025E $0.28 29, 2022 Pricing 2026E $0.79 Pricing 2026E $0.29 through 2027E $0.79 2027E $0.29 YE $ $ $ $ $ $ 0 . 1 . . 2 . 0 . 1 . 1 2022 — $ 75 50 25 — $ 50 00 50 Historical 2021A $1.54 Historical 2021A $1.04 2022A $2.00 Natural 2022A $1.18 2022E $1.64 2022E $0.88 Propane 2023E $1.61 2023E $0.87 ( Preliminary Gasoline $ NYMEX 2024E $1.47 ( NYMEX 2024E $0.83 Draft $ Strip Strip /Gal) – 2025E $1.38 /Gal) 2025E $0.79 Pricing 2026E $1.38 Pricing 2026E $0.76 Confidential 2027E $1.38 2027E $0.76

Preliminary Draft – Confidential LPG Market Overview NGL Consensus Pricing Commentary “3Q22 ethane prices of 55c/gal could fall to ~40c/gal in 4Q22/1Q23, with another step-down to 33c/gal in 2Q23+ as Henry Hub/Waha prices slide to $4.94/$2.18 per Mcf in 2Q23…ethane is typically 35-45% of the composite NGL barrel, causing its pricing to have an outsized impact on NGL prices vs. other purity products.” Chase Mulvehill, BofA Securities (October 9, 2022) “Given the significant increase in oil and gas prices driven by a host of factors including: a strong rebound in oil demand as the world emerges from COVID, continued supply-chain issues which are driving inflation, a tight global LNG market, and the Russia/Ukraine conflict, we are materially increasing our NGL price estimates. We’re raising our 2022 and 2023 NGL price estimates to $1.18/g and $1.06/g, respectively, from $0.92/g and $0.82/g. The increase to our NGL price deck reflects higher near-term crude oil and natural gas price estimates from our E&P and refining teams, partially offset by lower assumed LPG-to-Brent ratios.” Michael Blum, Wells Fargo (March 23, 2022) “The NGL-to-WTI and NGL-to-Brent crude oil ratios averaged 52% and 51%, respectively, in February, both of which are below the prior month. NGL prices to a large extent track Brent more closely than WTI, given that a significant portion of overall demand for NGLs is predicated on exports and competition in the global markets (e.g., ethylene derivative and LPG exports).” Praneeth Satish, Wells Fargo (March 23, 2022) “The move up in NGL pricing is driven by higher oil prices, which NGL pricing is tied to. But we are also seeing increasing demand (including exports) for NGLs moving up pricing relative to WTI (a higher % of WTI). Generally speaking, midstreamers with NGL marketing capabilities fare well in a rising price environment.” Robert Hope, Scotiabank (November 16, 2021) Source: Wall Street Research 23

Preliminary Draft – Confidential IV. DCP Financial Projections

Preliminary Draft – Confidential DCP Financial Projections DCP Financial Projections – Assumptions â—¼ï€ A The DCP Financial Projections as provided by DCP Management and reviewed by Evercore, incorporate the following assumptions:ï,„ï€ September 23, 2022 price deck as follows: Price Deck 2022E 2023E 2024E 2025E 2026E 2027E NGLs ($/Gal) $1.04 $0.75 $0.66 $0.60 $0.60 $0.60 WTI ($/Bbl) 93.75 73.80 68.04 64.12 61.16 58.81 Henry Hub ($/MMBtu) 7.26 5.56 4.76 4.59 4.52 4.50 ï,„ï€ Interest rates on debt as follows: NGL Composite Pricing • Revolving Credit Facility: Approximately 4.5%-5.5% annually $1.20 Management Forecast • Permanent Debt Average: Approximately 5.5%-6.0% annually $0.95 ï,„ï€ Preferred Equity redeemed once eligible and financed with debt $1.005 . 0 $0.75 and cash flow from operations: 1 $ $0.80 $0.66 3 • $500 Series A redeemed in Q3 2022 8 06 $0.60 $0.60 $0.60 0 . . 8 7 $0.60 $ 0 . • $161 Series B redeemed in Q2 2023 $ 0 71 7 6 $ 0 . 6 6 66 $ 0 . 0 . . • $110 Series C redeemed in Q4 2023 $0.40 0 $ $ $ ï,„ï€ Common Units outstanding: $0.20 • 90.6 million publicly held LP Units • 117.8 million DCP LP Units $— ï,„ï€ Quarterly distributions per LP held flat at $0.43/unit throughout 2021 A 2022 A 2022 E E 2023 2024 E E 2025 E 2026 E 2027 the projection period ï,„ï€ No minimum cash balance Historical NYMEX Strip Pricing (10/28/22) ï,„ï€ Maintenance capital expenditures of $134.7 million per year in 2022E, $150.0 million per year in 2023E and 2024E and $125.0 million per year from 2025E to 2027E ï,„ï€ Growth capital expenditures: • Identified organic capital expenditures of $114.4 million in 2H 2022 • Identified acquisition capital expenditures of $144.0 million in 2H 2022 • Unidentified organic capital expenditures of $125.0 million in 2023E and $50.0 million per year from 2024E to 2027E Source: DCP Management Note: DCP Financial Projections do not include effects of the Proposed Transaction 24

Preliminary Draft – Confidential DCP Financial Projections DCP Financial Projections – Sensitivity Assumptions â—¼ï€ DCP Management provided financial projections for DCP assuming the following commodity prices as requested by Evercore â—¼ï€ B A sensitivity case which assumes the following NYMEX Strip Pricing as of October 26, 2022 (“Sensitivity Case B – NYMEX Strip Pricing Case”): NYMEX Strip Pricing Case 2022E 2023E 2024E 2025E 2026E 2027E NGLs ($/Gal) $1.01 $0.75 $0.70 $0.67 $0.66 $0.66 WTI ($/Bbl) 95.10 81.18 74.19 69.88 66.71 64.08 Henry Hub ($/MMBtu) 6.50 5.23 4.64 4.47 4.40 4.35 â—¼ï€ C A sensitivity case which assumes the following higher commodity pricing (“Sensitivity Case C – Higher Commodity Prices”): Higher Commodity Prices 2022E 2023E 2024E 2025E 2026E 2027E NGLs ($/Gal) $1.01 $0.90 $0.78 $0.77 $0.76 $0.75 WTI ($/Bbl) 95.10 87.50 76.50 75.50 74.50 73.50 Henry Hub ($/MMBtu) 6.50 5.85 5.15 5.10 5.05 5.00 â—¼ï€ D A sensitivity case which assumes the following lower commodity pricing (“Sensitivity Case D – Lower Commodity Prices”): Lower Commodity Prices 2022E 2023E 2024E 2025E 2026E 2027E NGLs ($/Gal) $1.01 $0.59 $0.42 $0.42 $0.42 $0.42 WTI ($/Bbl) 95.10 40.00 40.00 40.00 40.00 40.00 Henry Hub ($/MMBtu) 6.50 2.25 2.25 2.25 2.25 2.25 25

Preliminary Draft – Confidential DCP Financial Projections DCP Financial Projections – NGL Price Cases NGL Composite Barrel ($/Gal) $1.40 $1.20 $1.00 ) /Gal $0.80 ( $ $0.75 s L NG $0.67 $0.60 $0.60 $0.42 $0.40 $0.20 $— Jan-18 Nov-18 Sep-19 Jul-20 May-21 Mar-22 Jan-23 Nov-23 Sep-24 Jul-25 May-26 Mar-27 Dec-27 Historicals DCP Financial Projections NYMEX Strip Pricing Case Higher Commodity Prices Lower Commodity Prices 26

Preliminary Draft – Confidential DCP Financial Projections A DCP Financial Projections ($ in millions, except per unit amounts) For the Years Ending December 31, 2022E-2027E 2022E 2023E 2024E 2025E 2026E 2027E CAGR Gathering & Processing Segment North Region $1,140 $864 $767 $726 $717 $711 (9.0%) South Region 191 147 137 129 128 127 (7.9%) Midcontinent Region 275 239 225 212 209 207 (5.5%) Permian Region 584 585 562 533 527 522 (2.2%) Other G&P -——————- Total Gathering & Processing Gross Margin $2,190 $1,835 $1,690 $1,601 $1,581 $1,568 (6.5%) Total Costs North Region ($157) ($144) ($154) ($154) ($156) ($158) 0.2% South Region (99) (99) (92) (92) (94) (95) (0.8%) Midcontinent Region (165) (162) (174) (174) (177) (179) 1.6% Permian Region (251) (293) (307) (308) (312) (317) 4.7% Other G&P (19) (23) (20) (21) (21) (21) 2.6% Total Gathering & Processing Costs ($691) ($721) ($748) ($748) ($760) ($771) 2.2% Total Gathering & Processing Segment Margin $1,499 $1,113 $942 $852 $821 $797 (11.9%) Logistics & Marketing Segment Southern Hills + Sand Hills $429 $436 $442 $449 $449 $449 0.9% Other NGL Pipelines 141 149 156 158 158 158 2.3% NGL Marketing + Storage 46 49 39 39 39 39 (3.2%) Downstream Fractionation 19 21 21 21 21 21 2.0% Gas Marketing + Other Income 18 13 13 13 13 13 (7.1%) Gas Storage 2 13 12 12 12 12 43.2% Guadalupe 62 48 40 40 40 40 (8.5%) Gulf Coast Express Equity Earnings 66 66 66 66 66 66 (0.0%) Cheyenne Connector Equity Earnings 14 14 14 14 14 14 0.0% Total Logistics & Marketing Gross Margin $798 $810 $804 $812 $812 $812 0.4% Total Costs Logistics & Marketing Costs ($44) ($47) ($41) ($41) ($42) ($42) (0.9%) Total Logistics & Marketing Segment Margin $754 $763 $763 $771 $771 $770 0.4% Source: DCP Management 27

Preliminary Draft – Confidential DCP Financial Projections A DCP Financial Projections – Summary Cash Flows ($ in millions, except per unit amounts) For the Years Ending December 31, 2022E-2027E 2022E 2023E 2024E 2025E 2026E 2027E CAGR Gathering & Processing Segment Margin $1,499 $1,113 $942 $852 $821 $797 (11.9%) Logistics & Marketing Segment Margin 754 763 763 771 771 770 0.4% Less: Corporate Costs (255) (257) (236) (236) (239) (243) (1.0%) Plus: Adj. Distribution in Excess of Equity Earnings—Logistics 77 80 80 80 80 80 0.9% Plus: Adj. Distribution in Excess of Equity Earnings—Discovery 13 9 9 9 9 9 (7.3%) Plus: Hedge settlement (339) (11) 2 (4) -—- Adjusted EBITDA $1,749 $1,698 $1,560 $1,473 $1,442 $1,414 (4.2%) Plus: Growth Projects -—- 18 25 32 39 Total Adjusted EBITDA $1,749 $1,698 $1,578 $1,498 $1,474 $1,453 (3.6%) Less: Interest Expense ($273) ($286) ($258) ($221) ($210) ($183) Less: Preferred Securities (58) (15) -———-Less: Sustaining Capital (135) (150) (150) (125) (125) (125) Less: Income Taxes (5) (5) (5) (5) (5) (5) Less: Other (3) (7) (7) (5) (5) (5) Distributable Cash Flow $1,275 $1,235 $1,157 $1,142 $1,128 $1,135 (2.3%) Identified Organic Capital ($140) $— $— $— $— $—Unidentified Organic Capital — (125) (50) (50) (50) (50) Acquisition Capital (160) -————- Distributions (342) (359) (359) (359) (359) (359) 1.0% Working Capital and Interest Timing (30) 133 90 -——- Cash Surplus / (Shortfall) $603 $884 $838 $733 $719 $726 3.8% LP Units Outstanding 208 209 209 209 209 209 0.0% Distributable Cash Flow per LP Unit $6.12 $5.92 $5.55 $5.47 $5.41 $5.44 (2.3%) Distribution per Unit 1.64 1.72 1.72 1.72 1.72 1.72 1.0% Total Distributions $342 $359 $359 $359 $359 $359 1.0% Source: DCP Management 28

Preliminary Draft – Confidential DCP Financial Projections A DCP Financial Projections – Sources and Uses ($ in millions) For the Years Ending December 31, 2022E 2023E 2024E 2025E 2026E 2027E Sources DCF Surplus / (Shortfall) $603 $884 $838 $733 $719 $726 Revolver Draw 246 -————- Total Sources $849 $884 $838 $733 $719 $726 Uses Revolver Paydown $— $113 $393 $— $— $— Long-Term Debt Paydown 350 500 — 825 — 500 Preferred Equity Redemption 500 271 -———-Cash Balance Increase / (Decrease) (1) — 445 (92) 719 226 Total Uses $849 $884 $838 $733 $719 $726 Memo: Cash $— $— $445 $353 $1,073 $1,298 Total Debt 5,331 4,718 4,325 3,500 3,500 3,000 Net Debt $5,331 $4,718 $3,880 $3,147 $2,427 $1,702 Preferred Equity 271 -————- Net Debt + Preferred Equity $5,602 $4,718 $3,880 $3,147 $2,427 $1,702 Total Debt / Adjusted EBITDA 3.0x 2.8x 2.7x 2.3x 2.4x 2.1x Net Debt / Adjusted EBITDA 3.0 2.8 2.5 2.1 1.6 1.2 (Net Debt + Preferred Equity) / Adjusted EBITDA 3.2 2.8 2.5 2.1 1.6 1.2 Source: DCP Management 29

Preliminary Draft – Confidential DCP Financial Projections B DCP Financial Projections ($ in millions, except per unit amounts) For the Years Ending December 31, 2022E-2027E 2022E 2023E 2024E 2025E 2026E 2027E CAGR Gathering & Processing Segment North Region $1,075 $855 $797 $771 $752 $744 (7.1%) South Region 190 152 143 137 134 133 (6.9%) Midcontinent Region 275 243 230 218 213 211 (5.2%) Permian Region 572 590 569 541 532 526 (1.7%) Other G&P -——————- Total Gathering & Processing Gross Margin $2,112 $1,840 $1,739 $1,668 $1,631 $1,614 (5.2%) Total Costs North Region ($157) ($144) ($154) ($154) ($156) ($158) 0.2% South Region (99) (99) (92) (92) (94) (95) (0.8%) Midcontinent Region (165) (162) (174) (174) (177) (179) 1.6% Permian Region (251) (293) (307) (308) (312) (317) 4.7% Other G&P (19) (23) (20) (21) (21) (21) 2.6% Total Gathering & Processing Costs ($691) ($721) ($748) ($748) ($760) ($771) 2.2% Total Gathering & Processing Segment Margin $1,421 $1,118 $991 $919 $871 $844 (9.9%) Logistics & Marketing Segment Southern Hills + Sand Hills $429 $436 $442 $449 $449 $449 0.9% Other NGL Pipelines 141 149 156 158 158 158 2.3% NGL Marketing + Storage 46 49 39 39 39 39 (3.2%) Downstream Fractionation 19 21 21 21 21 21 2.0% Gas Marketing + Other Income 18 13 13 13 13 13 (7.1%) Gas Storage 2 13 12 12 12 12 43.2% Guadalupe 62 48 40 40 40 40 (8.5%) Gulf Coast Express Equity Earnings 66 66 66 66 66 66 (0.0%) Cheyenne Connector Equity Earnings 14 14 14 14 14 14 0.0% Total Logistics & Marketing Gross Margin $798 $810 $804 $812 $812 $812 0.4% Total Costs Logistics & Marketing Costs ($44) ($47) ($41) ($41) ($42) ($42) (0.9%) Total Logistics & Marketing Segment Margin $754 $763 $763 $771 $771 $770 0.4% Source: DCP Management 30

Preliminary Draft – Confidential DCP Financial Projections B DCP Financial Projections – Summary Cash Flows ($ in millions, except per unit amounts) For the Years Ending December 31, 2022E-2027E 2022E 2023E 2024E 2025E 2026E 2027E CAGR Gathering & Processing Segment Margin $1,421 $1,118 $991 $919 $871 $844 (9.9%) Logistics & Marketing Segment Margin 754 763 763 771 771 770 0.4% Less: Corporate Costs (255) (257) (236) (236) (239) (243) (1.0%) Plus: Adj. Distribution in Excess of Equity Earnings—Logistics 77 80 80 80 80 80 0.9% Plus: Adj. Distribution in Excess of Equity Earnings—Discovery 13 9 9 9 9 9 (7.3%) Plus: Hedge settlement (294) (16) (2) (3) -—- Adjusted EBITDA $1,717 $1,698 $1,606 $1,541 $1,492 $1,460 (3.2%) Plus: Growth Projects -—- 18 25 32 39 Total Adjusted EBITDA $1,717 $1,698 $1,624 $1,566 $1,524 $1,499 (2.7%) Less: Interest Expense ($273) ($287) ($258) ($220) ($210) ($183) Less: Preferred Securities (58) (15) -———-Less: Sustaining Capital (135) (150) (150) (125) (125) (125) Less: Income Taxes (5) (5) (5) (5) (5) (5) Less: Other (3) (7) (7) (5) (5) (5) Distributable Cash Flow $1,242 $1,234 $1,203 $1,210 $1,179 $1,181 (1.0%) Identified Organic Capital ($140) $— $— $— $— $—Unidentified Organic Capital — (125) (50) (50) (50) (50) Acquisition Capital (160) -————- Distributions (342) (359) (359) (359) (359) (359) 1.0% Working Capital and Interest Timing (30) 133 90 -——- Cash Surplus / (Shortfall) $570 $883 $884 $801 $770 $772 6.3% LP Units Outstanding 208 209 209 209 209 209 0.0% Distributable Cash Flow per LP Unit $5.96 $5.91 $5.77 $5.80 $5.65 $5.66 (1.0%) Distribution per Unit 1.68 1.72 1.72 1.72 1.72 1.72 0.5% Total Distributions $342 $359 $359 $359 $359 $359 1.0% Source: DCP Management 31

Preliminary Draft – Confidential DCP Financial Projections B DCP Financial Projections – Sources and Uses ($ in millions) For the Years Ending December 31, 2022E 2023E 2024E 2025E 2026E 2027E Sources DCF Surplus / (Shortfall) $570 $883 $884 $801 $770 $772 Revolver Draw 279 -————- Total Sources $849 $883 $884 $801 $770 $772 Uses Revolver Paydown $— $112 $427 $— $— $— Long-Term Debt Paydown 350 500 — 825 — 500 Preferred Equity Redemption 500 271 -———-Cash Balance Increase / (Decrease) (1) — 457 (24) 770 272 Total Uses $849 $883 $884 $801 $770 $772 Memo: Cash $— $— $457 $433 $1,203 $1,475 Total Debt 5,364 4,752 4,325 3,500 3,500 3,000 Net Debt $5,364 $4,752 $3,868 $3,067 $2,297 $1,525 Preferred Equity 271 -————- Net Debt + Preferred Equity $5,635 $4,752 $3,868 $3,067 $2,297 $1,525 Total Debt / Adjusted EBITDA 3.1x 2.8x 2.7x 2.2x 2.3x 2.0x Net Debt / Adjusted EBITDA 3.1 2.8 2.4 2.0 1.5 1.0 (Net Debt + Preferred Equity) / Adjusted EBITDA 3.3 2.8 2.4 2.0 1.5 1.0 Source: DCP Management 32

Preliminary Draft – Confidential DCP Financial Projections C DCP Financial Projections ($ in millions, except per unit amounts) For the Years Ending December 31, 2022E-2027E 2022E 2023E 2024E 2025E 2026E 2027E CAGR Gathering & Processing Segment North Region $1,075 $1,005 $884 $890 $878 $867 (4.2%) South Region 190 162 147 144 143 142 (5.7%) Midcontinent Region 275 254 232 222 221 220 (4.4%) Permian Region 572 612 577 557 555 552 (0.7%) Other G&P -——————- Total Gathering & Processing Gross Margin $2,112 $2,033 $1,839 $1,812 $1,796 $1,780 (3.4%) Total Costs North Region ($157) ($144) ($154) ($154) ($156) ($158) 0.2% South Region (99) (99) (92) (92) (94) (95) (0.8%) Midcontinent Region (165) (162) (174) (174) (177) (179) 1.6% Permian Region (251) (293) (307) (308) (312) (317) 4.7% Other G&P (19) (23) (20) (21) (21) (21) 2.6% Total Gathering & Processing Costs ($691) ($721) ($748) ($748) ($760) ($771) 2.2% Total Gathering & Processing Segment Margin $1,421 $1,312 $1,091 $1,064 $1,037 $1,010 (6.6%) Logistics & Marketing Segment Southern Hills + Sand Hills $429 $436 $442 $449 $449 $449 0.9% Other NGL Pipelines 141 149 156 158 158 158 2.3% NGL Marketing + Storage 46 49 39 39 39 39 (3.2%) Downstream Fractionation 19 21 21 21 21 21 2.0% Gas Marketing + Other Income 18 13 13 13 13 13 (7.1%) Gas Storage 2 13 12 12 12 12 43.2% Guadalupe 62 48 40 40 40 40 (8.5%) Gulf Coast Express Equity Earnings 66 66 66 66 66 66 (0.0%) Cheyenne Connector Equity Earnings 14 14 14 14 14 14 0.0% Total Logistics & Marketing Gross Margin $798 $810 $804 $812 $812 $812 0.4% Total Costs Logistics & Marketing Costs ($44) ($47) ($41) ($41) ($42) ($42) (0.9%) Total Logistics & Marketing Segment Margin $754 $763 $763 $771 $771 $770 0.4% Source: DCP Management 33

Preliminary Draft – Confidential DCP Financial Projections C DCP Financial Projections – Summary Cash Flows ($ in millions, except per unit amounts) For the Years Ending December 31, 2022E-2027E 2022E 2023E 2024E 2025E 2026E 2027E CAGR Gathering & Processing Segment Margin $1,421 $1,312 $1,091 $1,064 $1,037 $1,010 (6.6%) Logistics & Marketing Segment Margin 754 763 763 771 771 770 0.4% Less: Corporate Costs (255) (257) (236) (236) (239) (243) (1.0%) Plus: Adj. Distribution in Excess of Equity Earnings—Logistics 77 80 80 80 80 80 0.9% Plus: Adj. Distribution in Excess of Equity Earnings—Discovery 13 9 9 9 9 9 (7.3%) Plus: Hedge settlement (294) (47) (8) (8) -—- Adjusted EBITDA $1,717 $1,860 $1,700 $1,681 $1,657 $1,626 (1.1%) Plus: Growth Projects -—- 18 25 32 39 Total Adjusted EBITDA $1,717 $1,860 $1,718 $1,706 $1,690 $1,666 (0.6%) Less: Interest Expense ($273) ($282) ($256) ($220) ($210) ($183) Less: Preferred Securities (58) (15) -———-Less: Sustaining Capital (135) (150) (150) (125) (125) (125) Less: Income Taxes (5) (5) (5) (5) (5) (5) Less: Other (3) (7) (7) (5) (5) (5) Distributable Cash Flow $1,242 $1,401 $1,300 $1,351 $1,344 $1,347 1.6% Identified Organic Capital ($140) $— $— $— $— $—Unidentified Organic Capital — (125) (50) (50) (50) (50) Acquisition Capital (160) -————- Distributions (342) (359) (359) (359) (359) (359) 1.0% Working Capital and Interest Timing (30) 133 90 -——- Cash Surplus / (Shortfall) $570 $1,050 $981 $942 $935 $938 10.5% LP Units Outstanding 208 209 209 209 209 209 0.0% Distributable Cash Flow per LP Unit $5.96 $6.71 $6.23 $6.47 $6.44 $6.46 1.6% Distribution per Unit 1.68 1.72 1.72 1.72 1.72 1.72 0.5% Total Distributions $342 $359 $359 $359 $359 $359 1.0% Source: DCP Management 34

Preliminary Draft – Confidential DCP Financial Projections C DCP Financial Projections – Sources and Uses ($ in millions) For the Years Ending December 31, 2022E 2023E 2024E 2025E 2026E 2027E Sources DCF Surplus / (Shortfall) $570 $1,050 $981 $942 $935 $938 Revolver Draw 279 -————- Total Sources $849 $1,050 $981 $942 $935 $938 Uses Revolver Paydown $— $279 $260 $— $— $— Long-Term Debt Paydown 350 500 — 825 — 500 Preferred Equity Redemption 500 271 -———-Cash Balance Increase / (Decrease) (1) — 720 117 935 438 Total Uses $849 $1,050 $981 $942 $935 $938 Memo: Cash $— $— $720 $837 $1,772 $2,211 Total Debt 5,364 4,585 4,325 3,500 3,500 3,000 Net Debt $5,364 $4,585 $3,605 $2,663 $1,728 $789 Preferred Equity 271 -————- Net Debt + Preferred Equity $5,635 $4,585 $3,605 $2,663 $1,728 $789 Total Debt / Adjusted EBITDA 3.1x 2.5x 2.5x 2.1x 2.1x 1.8x Net Debt / Adjusted EBITDA 3.1 2.5 2.1 1.6 1.0 0.5 (Net Debt + Preferred Equity) / Adjusted EBITDA 3.3 2.5 2.1 1.6 1.0 0.5 Source: DCP Management 35

Preliminary Draft – Confidential DCP Financial Projections D DCP Financial Projections ($ in millions, except per unit amounts) For the Years Ending December 31, 2022E-2027E 2022E 2023E 2024E 2025E 2026E 2027E CAGR Gathering & Processing Segment North Region $1,075 $478 $397 $414 $414 $414 (17.4%) South Region 190 127 115 113 113 113 (9.9%) Midcontinent Region 275 222 209 201 201 201 (6.1%) Permian Region 572 487 487 469 469 469 (3.9%) Other G&P -——————- Total Gathering & Processing Gross Margin $2,112 $1,314 $1,208 $1,197 $1,197 $1,197 (10.7%) Total Costs North Region ($157) ($144) ($154) ($154) ($156) ($158) 0.2% South Region (99) (99) (92) (92) (94) (95) (0.8%) Midcontinent Region (165) (162) (174) (174) (177) (179) 1.6% Permian Region (251) (293) (307) (308) (312) (317) 4.7% Other G&P (19) (23) (20) (21) (21) (21) 2.6% Total Gathering & Processing Costs ($691) ($721) ($748) ($748) ($760) ($771) 2.2% Total Gathering & Processing Segment Margin $1,421 $593 $460 $449 $437 $426 (21.4%) Logistics & Marketing Segment Southern Hills + Sand Hills $429 $436 $442 $449 $449 $449 0.9% Other NGL Pipelines 141 149 156 158 158 158 2.3% NGL Marketing + Storage 46 49 39 39 39 39 (3.2%) Downstream Fractionation 19 21 21 21 21 21 2.0% Gas Marketing + Other Income 18 13 13 13 13 13 (7.1%) Gas Storage 2 13 12 12 12 12 43.2% Guadalupe 62 48 40 40 40 40 (8.5%) Gulf Coast Express Equity Earnings 66 66 66 66 66 66 (0.0%) Cheyenne Connector Equity Earnings 14 14 14 14 14 14 0.0% Total Logistics & Marketing Gross Margin $798 $810 $804 $812 $812 $812 0.4% Total Costs Logistics & Marketing Costs ($44) ($47) ($41) ($41) ($42) ($42) (0.9%) Total Logistics & Marketing Segment Margin $754 $763 $763 $771 $771 $770 0.4% Source: DCP Management 36

Preliminary Draft – Confidential DCP Financial Projections D DCP Financial Projections – Summary Cash Flows ($ in millions, except per unit amounts) For the Years Ending December 31, 2022E-2027E 2022E 2023E 2024E 2025E 2026E 2027E CAGR Gathering & Processing Segment Margin $1,421 $593 $460 $449 $437 $426 (21.4%) Logistics & Marketing Segment Margin 754 763 763 771 771 770 0.4% Less: Corporate Costs (255) (257) (236) (236) (239) (243) (1.0%) Plus: Adj. Distribution in Excess of Equity Earnings—Logistics 77 80 80 80 80 80 0.9% Plus: Adj. Distribution in Excess of Equity Earnings—Discovery 13 9 9 9 9 9 (7.3%) Plus: Hedge settlement (294) 112 42 13 -—- Adjusted EBITDA $1,717 $1,300 $1,118 $1,087 $1,058 $1,043 (9.5%) Plus: Growth Projects -—- 18 25 32 39 Total Adjusted EBITDA $1,717 $1,300 $1,136 $1,112 $1,090 $1,082 (8.8%) Less: Interest Expense ($273) ($302) ($286) ($262) ($247) ($229) Less: Preferred Securities (58) (15) -———-Less: Sustaining Capital (135) (150) (150) (125) (125) (125) Less: Income Taxes (5) (5) (5) (5) (5) (5) Less: Other (3) (7) (7) (5) (5) (5) Distributable Cash Flow $1,242 $822 $688 $715 $708 $718 (10.4%) Identified Organic Capital ($140) $— $— $— $— $—Unidentified Organic Capital — (125) (50) (50) (50) (50) Acquisition Capital (160) -————- Distributions (342) (359) (359) (359) (359) (359) 1.0% Working Capital and Interest Timing (30) 133 90 -——- Cash Surplus / (Shortfall) $570 $471 $369 $306 $299 $309 (11.5%) LP Units Outstanding 208 209 209 209 209 209 0.0% Distributable Cash Flow per LP Unit $5.96 $3.94 $3.30 $3.43 $3.39 $3.44 (10.4%) Distribution per Unit 1.68 1.72 1.72 1.72 1.72 1.72 0.5% Total Distributions $342 $359 $359 $359 $359 $359 1.0% Source: DCP Management 37

Preliminary Draft – Confidential DCP Financial Projections D DCP Financial Projections – Sources and Uses ($ in millions) For the Years Ending December 31, 2022E 2023E 2024E 2025E 2026E 2027E Sources DCF Surplus / (Shortfall) $570 $471 $369 $306 $299 $309 Revolver Draw 279 300 — 519 — 191 Total Sources $849 $771 $369 $825 $299 $500 Uses Revolver Paydown $— $— $369 $— $299 $— Long-Term Debt Paydown 350 500 — 825 — 500 Preferred Equity Redemption 500 271 -———-Cash Balance Increase / (Decrease) (1) -————- Total Uses $849 $771 $369 $825 $299 $500 Memo: Cash $— $— $— $— $— $— Total Debt 5,364 5,164 4,795 4,489 4,190 3,881 Net Debt $5,364 $5,164 $4,795 $4,489 $4,190 $3,881 Preferred Equity 271 -————- Net Debt + Preferred Equity $5,635 $5,164 $4,795 $4,489 $4,190 $3,881 Total Debt / Adjusted EBITDA 3.1x 4.0x 4.2x 4.0x 3.8x 3.6x Net Debt / Adjusted EBITDA 3.1 4.0 4.2 4.0 3.8 3.6 (Net Debt + Preferred Equity) / Adjusted EBITDA 3.3 4.0 4.2 4.0 3.8 3.6 Source: DCP Management 38

Preliminary Draft – Confidential DCP Financial Projections DCP Financial Projections Summary – Comparison to Wall Street Consensus Estimates ($ in millions) Adjusted EBITDA Distributable Cash Flow $1,749 $1,776 $1,751 $1,698 $1,642 $1,662 $1,578 $1,580 $1,616 $1,498 $1,474 $1,453 $1,355 $1,327 $1,275 $1,235 $1,247 $1,283 $1,210 $1,186 $1,157 $1,142 $1,128 $1,135 2022E 2023E 2024E 2025E 2026E 2027E 2022E 2023E 2024E 2025E 2026E 2027E Distributed Cash Flow Net Debt / Adjusted EBITDA Coverage Ratio: 3.7x 3.4x 3.2x 3.2x 3.1x 3.2x 3.0x 2.7x 2.8x 3.8x 3.6x 3.1x 3.1x 3.1x 3.2x 2.4x 2.5x 2.4x 2.1x 1.6x 1.2x $359$373 $359$390 $359$386 $359$396 $359$406 $342$346 NA NA NA 2022E 2023E 2024E 2025E 2026E 2027E 2022E 2023E 2024E 2025E 2026E 2027E DCP Financial Projections Wall Street Consensus Estimates Source: DCP Management; FactSet; as of October 28, 2022 39

. 1 $1,749 Source: $ . 3 $1,717342 7x DCP DCP 2022E Coverage 2022E $1,717 DCP Projected $1,717Ratio: $1,698 Management; DCP $ . 3 $1,698 distributions359 4x $1,860 2023E 2023E Financial remain $1,300FactSet; theas Financial $1,578 Financial3 of $ . same 2x $1,624359 $1,718 2024E 2024E October $1,136 through Projections Distributed Adjusted 28,$1,498 Projections 2022 $ . 3 Cash $1,566 sensitivity 359 2x2025E 2025E $1,706 cases Flow $1,112 EBITDA Projections 1 $1,474 $ . 3 Summary $1,524 359 1x – $1,690 NYMEX 2026E 2026E Strip Sensitivity $1,090$1,453 $ . 3 Case $1,499 Pricing 359 2x $1,666 B 2027E 2027E Case – $1,082 Comparison to403.0x $1,275 3.1x $1,242 2022E 3.1x 2022E $1,242 Higher 3.1x $1,242 Sensitivity 2.8x $1,235 Sensitivity 2.8x $1,234 Commodity Case 2023E 2.5x 2023E $1,401 Cases 4.0x $822Net C –Prices 2.5x $1,157 2.4x Debt $1,203 2024E 2.1x / 2024E $1,300 4.2x $688 Distributable $1,1422.1x 2.0x Adjusted $1,210 1.6x $1,351 Cash 2025E 2025E Lower 4.0x $715Flow Preliminary Sensitivity 1.6x EBITDA $1,1281.5x $1,179 1.0x $1,344 ( Draft 2026E 2026E $ Commodity Case – C 3.8x $708 in –Prices 1.2x $1,135 1.0x $1,181 2027E 0.5x 2027E $1,347 Confidential 3.6x $718 millions)

Preliminary Draft – Confidential V. Preliminary Valuation of the Common Units

Preliminary Draft – Confidential Preliminary Valuation of the Common Units Valuation MethodologiesEvercore utilized the following methodologies to analyze the value of the Common Units: Methodology Description Assumptions / DetailValues the Common Units based on the concept ofProjected cash flow discounted to 12/31/22 the time value of moneyUtilizes varying weighted average cost of capitalEBITDA exit multiple based on peer group trading multiples and Discounted (“WACC”) discount rates and applies various precedent transaction multiples Cash Flow perpetuity growth rates to derive after-tax valuationWACC based on the Capital Asset Pricing Model (“CAPM”) Analysis rangesCalculated terminal values based on a range of multiples of EBITDA and assumed perpetuity growth ratesValues the Common Units based on the present valueProjected distributions discounted to 12/31/22 of the future cash distributions DiscountedTerminal yield range based on the distribution yield at which DCP Distributions has traded over the last 52 weeks AnalysisCost of equity based on CAPM and total expected market return for MLPs and companies with similar assets to those of DCPValues the Common Units based on EV/EBITDA andEV/EBITDA multiples applied to 2023E and 2024E EBITDA Peer Group Price/DCF trading multiplesPrice/DCF LP unit applied to 2023E and 2024E DCF/LP unit TradingMultiples selected based on EV/EBITDA and Analysis Price/DCF multiples of MLPs and companies with assets similar to those owned by DCP PrecedentValues the Common Units based on multiples ofEV/EBITDA multiples applied to 2022E EBITDA M&A transaction value to EBITDA in historical transactions involving assets similar to those owned by DCP Transaction AnalysisFor PremiumsValues DCP common units based on historicalMedian 1-Day spot and 20-Day volume weighted average price Reference premiums paid in (i) MLP buy-ins and (ii) MLP mergers (“VWAP”) premiums paid applied to relevant unit prices Only Paid Analysis since 2018 41

Preliminary Draft – Confidential Preliminary Valuation of the Common Units Summary Updates to Valuation Assumptions Methodology 1st Committee Meeting Current PresentationWACC: 8.0%—9.0%WACC: 7.5%—8.5% Discounted Cash Flow AnalysisEquity Cost of Capital Based on CAPM: 10.0%—12.0%Equity Cost of Capital Based on CAPM: 9.5%—11.5% Discounted Distributions Analysis2023E EV/EBITDA multiples: 8.0x—9.0x2023E EV/EBITDA multiples: 8.25x—9.25x2024E EV/EBITDA multiples: 7.5x—8.5x2024E EV/EBITDA multiples: 8.0x – 9.0x Peer Group2023E Price/DCF multiples: 6.5x—7.5x2023E Price/DCF multiples: 7.0x – 8.0x Trading Analysis2024E Price/DCF multiples: 5.5x—6.5x2024E Price/DCF multiples: 6.0x – 7.0x 42

Preliminary Draft – Confidential Preliminary Valuation of the Common Units Preliminary Valuation Summary For Reference Only Discounted Peer Group Discounted Cash Flow Analysis Distributions Trading Analysis MLP Analyst Analysis Precedent M&A Premiums Price Transaction Analysis Paid Targets Market Price/DCF Exit Multiple Perpetuity Grow th CAPM EV/EBITDA Return per LP Unit $65.00 Implied range based on 5% $54.65 $55.07 $55.00 annual $53.69 $53.23 distribution $50.34 growth $48.07 $48.74 $48.74 $48.74 through $47.92 $47.32 $47.28 $45.37 $44.04 $46.22 2027E1 $45.00 $45.00 $43.34 $44.05 $45.02 $40.76 $38.33 $39.96 $35.00 $37.98 $38.56 $34.23 $38.55 $37.36 $38.00 $36.18 $32.22 $34.96 $34.59 $31.49 $33.36 $30.38 $33.65 $33.27 $31.86 $32.37 $32.37 $32.37 $31.50 $30.17 $29.71 $24.23 $23.66 $25.00 $26.59 Price as of 10/28/22: $39.50 $25.10 Proposed Consideration: $34.75 $19.79 $18.93 $15.00 $16.36 $13.67 $5.00 4.0%—5.0% 7.5%—8.5% WACC Terminal Yield 8.25x—9.25x 7.0x—8.0x 2023E EBITDA 2023E DCF/LP Unit Median 9.5%—11.0%—Merger Analyst 7.25x—9.25x 11.5% 13.0% Premium: Price 8.25x—9.25x 0.5%—1.5% 2022E EBITDA Equity Equity 15.0%—Targets Exit Multiple Perpetuity Grow th Rate 8.0x—9.0x 6.0x—7.0x Cost of Cost of 2024E EBITDA 2024E DCF/LP Unit 30.0% Capital Capital Sensitivity Case B – Sensitivity Case C – Sensitivity Case C –DCP Financial Projections NYMEX Strip Pricing Case Higher Commodity Prices Lower Commodity Prices 1. For reference only: sensitivity case using a 5% annual distribution growth rate which assumes lower than the commodity super cycle board assumption of 7.5% growth and management 0% growth scenarios 43

Preliminary Draft – Confidential Preliminary Valuation of the Common Units A Discounted Cash Flow Analysis ($ in millions, except per unit amounts) Summary Results For the Years Ending December 31, Exit Perpetuity 2023E 2024E 2025E 2026E 2027E Multiple Growth Adjusted EBITDA $1,698 $1,578 $1,498 $1,474 $1,453 $1,453 $1,453 Less: Tax Depreciation and Amortization¹ (13,806) (154) (127) (118) (116) (125) EBIT ($12,108) $1,424 $1,371 $1,356 $1,338 $1,328 Less: Cash Taxes — (84) (81) (100) (99) (491) EBIAT ($12,108) $1,340 $1,290 $1,255 $1,239 $837 Plus: Tax Depreciation and Amortization 13,806 154 127 118 116 125 Less: Maintenance Capex (150) (150) (125) (125) (125) (125) Less: Growth Capex (125) (50) (50) (50) (50) —Unlevered Free Cash Flow $1,423 $1,293 $1,242 $1,199 $1,179 $837 EBITDA Multiple / Perpetuity Growth Rate 8.75x 1.0% Implied Terminal Value $12,714 $12,072 Present Value of Terminal Value @ 8.0% Discount Rate $8,653 $7,906 Plus: Present Value of Unlevered Free Cash Flow @ 8.0% Discount Rate 5,295 Implied Enterprise Value $13,948 $13,201 Less: Preferred Equity2 ($271) Less: Net Debt2 (5,331) Less: Noncontrolling Interests2 (25) Implied Equity Value $8,321 $7,574 DCP Units Outstanding3 210 Implied Value per Unit $39.69 $36.13 Sensitivity Analysis Terminal Exit Multiple Perpetuity Growth Rate 7.75x 8.25x 8.75x 9.25x 9.75x —% 0.5% 1.0% 1.5% 2.0% 7.0% $37.25 $39.72 $42.19 $44.67 $47.14 7.0% $38.25 $41.49 $45.26 $49.72 $55.07 7.5% 36.10 38.51 40.93 43.34 45.76 7.5% 34.43 37.18 40.34 44.04 48.41 WACC 8.0% 34.98 37.33 39.69 42.05 44.41 WACC 8.0% 31.09 33.44 36.13 39.23 42.85 8.5% 33.88 36.18 38.49 40.79 43.10 8.5% 28.13 30.17 32.47 35.10 38.14 9.0% 32.81 35.06 37.32 39.57 41.82 9.0% 25.51 27.28 29.27 31.52 34.10 44 1. 2023E tax DD&A assumes 80% bonus depreciation calculated as the midpoint of the enterprise value range plus 2023E capital expenditures 2. Per DCP Management as of December 31, 2022 3. Includes 117.8mm common units held by DCP Midstream, LLC and DCP Midstream GP, LP, and 1.3mm phantom and performance units

Preliminary Draft – Confidential Preliminary Valuation of the Common Units Discounted Distribution Analysis For the Years Ending December 31, Terminal Value 2023E 2024E 2025E 2026E 2027E Low High DCP Distribution per Unit (Cash, As Paid) $1.72 $1.72 $1.72 $1.72 $1.72 $1.72 – $1.72 Terminal Yield1 5.0% 4.0% Terminal Value $34.40 $43.00 Equity Cost of Capital Based on CAPM Present Value @ 8.5% Cost of Equity $29.94 – $35.66 Present Value @ 9.5% Cost of Equity 28.76 – 34.23 Present Value @ 10.5% Cost of Equity 27.65 – 32.87 Present Value @ 11.5% Cost of Equity 26.59 – 31.58 Present Value @ 12.5% Cost of Equity 25.59 – 30.36 Implied DCP Unit Value – Based on CAPM $26.59 – $34.23 Equity Cost of Capital Based on Total Expected Market Return2,3 Present Value @ 10.0% Cost of Equity $28.20 – $33.54 Present Value @ 11.0% Cost of Equity 27.11 – 32.22 Present Value @ 12.0% Cost of Equity 26.08 – 30.96 Present Value @ 13.0% Cost of Equity 25.10 – 29.77 Present Value @ 14.0% Cost of Equity 24.17 – 28.64 Implied DCP Unit Value – Based on Total Expected Market Return $25.10 – $32.22 Source: DCP Management 1. Based on DCP’s 52-week yield range of 4.0% to 5.6% with a median of 4.5% and mean of 4.5%; Current yield is 4.4% as of October 28, 2022 2. Detail on Equity Cost of Capital calculations in Appendix 3. Assumes terminal year distribution grows 2.5%—3.5% in low and high terminal values, respectively, in line with Wall St estimates 45

Preliminary Draft – Confidential Preliminary Valuation of the Common Units Discounted Distribution Analysis – 5% Annual Distribution Growth For Reference Only For the Years Ending December 31, Terminal Value 2023E 2024E 2025E 2026E 2027E Low High DCP Distribution per Unit (Cash, As Paid) $1.72 $1.81 $1.90 $1.99 $2.09 $2.09 – $2.09 Distribution Growth 5.0% 5.0% 5.0% 5.0% Terminal Yield1 5.0% 4.0% Terminal Value $41.80 $52.25 Equity Cost of Capital Based on CAPM Present Value @ 8.5% Cost of Equity $35.54 – $42.49 Present Value @ 9.5% Cost of Equity 34.12 – 40.76 Present Value @ 10.5% Cost of Equity 32.78 – 39.12 Present Value @ 11.5% Cost of Equity 31.50 – 37.57 Present Value @ 12.5% Cost of Equity 30.29 – 36.09 Implied DCP Unit Value – Based on CAPM $31.50 – $40.76 Equity Cost of Capital Based on Total Expected Market Return2,3 Present Value @ 10.0% Cost of Equity $33.44 – $39.93 Present Value @ 11.0% Cost of Equity 32.13 – 38.33 Present Value @ 12.0% Cost of Equity 30.89 – 36.82 Present Value @ 13.0% Cost of Equity 29.71 – 35.38 Present Value @ 14.0% Cost of Equity 28.59 – 34.01 Implied DCP Unit Value – Based on Total Expected Market Return $29.71 – $38.33 Source: DCP Management Note: Sensitivity case using a 5% annual distribution growth rate which assumes lower than the commodity super cycle board assumption of 7.5% growth and management 0% growth scenarios 1. Based on DCP’s 52-week yield range of 4.0% to 5.6% with a median of 4.5% and mean of 4.5%; Current yield is 4.4% as of October 28, 2022 2. Detail on Equity Cost of Capital calculations in Appendix 3. Assumes terminal year distribution grows 2.5%—3.5% in low and high terminal values, respectively, in line with Wall St estimates 46

Preliminary Draft – Confidential Preliminary Valuation of the Common Units Peer Group Trading Analysis ($ in millions, except per unit/share amounts) Price/DCF Price Equity Enterprise Enterprise Value/EBITDA / CAFD per Share Distribution Yield Dist. Net Debt / Parthership / Company 10/28/22 Value Value 2022E 2023E 2024E 2023E 2024E Current 2023E Growth 2022E EBITDA Gathering & Processing MLPs/Companies Antero Midstream Corporation $10.49 $5,076 $8,445 9.6x 8.9x 8.5x 8.7x 8.5x 8.6% 8.6% NM 3.8x Crestwood Equity Partners LP 30.64 3,786 7,928 9.7 8.5 8.0 5.5 5.2 8.6% 8.8% 5.0% 3.8 DT Midstream, Inc. 58.89 5,769 9,181 11.2 9.5 9.1 9.0 8.7 4.3% 4.6% 5.0% 4.0 EnLink Midstream, LLC 11.68 5,743 11,969 9.4 9.0 8.9 5.8 5.8 3.9% 4.2% 10.0% 3.6 Equitrans Midstream Corporation 8.20 3,587 11,074 10.4 10.2 8.8 8.0 5.9 7.3% 7.3% 2.4% 5.9 Hess Midstream Partners LP 28.65 6,876 9,811 10.0 9.3 8.6 7.9 7.6 7.8% 8.2% 4.0% 3.0 Kinetik Holdings Inc. 36.29 4,899 8,386 10.1 9.4 8.3 6.7 5.8 8.3% 8.6% 4.2% 4.2 ONEOK, Inc. 59.72 26,792 40,424 11.2 10.4 10.2 11.1 10.5 6.3% 6.3% 3.0% 3.8 Summit Midstream Partners, LP 19.95 209 1,933 9.0 5.7 6.8 NM NM —% —% NM 7.1 Targa Resources Corp. 67.16 15,522 28,685 9.0 8.8 8.3 6.8 6.3 2.1% 2.3% 5.0% 3.4 Western Midstream Partners, LP 28.41 11,048 17,819 8.2 7.9 7.7 6.7 6.2 7.0% 7.0% 11.2% 3.1 Mean 9.8x 8.9x 8.5x 7.6x 7.0x 5.8% 6.0% 5.5% 4.1x Median 9.7 9.0 8.5 7.3 6.2 7.0% 7.0% 5.0% 3.8 DCP Midstream, LP (Consensus) $39.50 $8,281 $14,336 8.1x 8.2x 8.7x 5.7x 6.6x 4.4% 4.6% 3.1% 3.0x DCP Midstream, LP (DCP Financial Projections) $39.50 $8,281 $14,336 8.2x 8.4x 9.1x 6.7x 7.1x 4.4% 4.4% —% 2.9x Source: Company filings, FactSet, Wall Street Research; as of October 28, 2022 47

Preliminary Draft – Confidential Preliminary Valuation of the Common Units A Peer Group Trading Analysis – EV/EBITDA ($ in millions, except per unit amounts) 2023E Adjusted EBITDA $1,698 Relevant EBITDA Multiple 8.25x—9.25x Implied Enterprise Value Based on 2023E Adjusted EBITDA $14,006—$15,704 Less: Preferred Equity1 (271) Less: Net Debt1 (5,331) Less: Noncontrolling Interests1 (25) Implied Equity Value $8,379—$10,077 DCP Units Outstanding 210 Implied DCP Unit Price Range—2023E EBITDA $39.97—$48.07 2024E Adjusted EBITDA $1,578 Relevant EBITDA Multiple 8.0x—9.0x Implied Enterprise Value Based on 2024E Adjusted EBITDA $12,621—$14,199 Less: Preferred Equity1 (271) Less: Net Debt1 (5,331) Less: Noncontrolling Interests1 (25) Implied Equity Value $6,994—$8,572 DCP Units Outstanding 210 Implied DCP Unit Price Range—2024E EBITDA $33.36—$40.89 Implied DCP Unit Price Range—2023E and 2024E EBITDA $33.36—$48.07 1. As of December 31, 2022 48

Preliminary Draft – Confidential Preliminary Valuation of the Common Units A Peer Group Trading Analysis – Price/DCF per LP Unit ($ in millions, except per unit amounts) 2023E DCF / LP Unit $5.92 Relevant Multiple 7.0x—8.0x Implied DCP Unit Price Range—2023E Price / DCF $41.41—$47.32 2024E DCF / LP Unit $5.55 Relevant Multiple 6.0x—7.0x Implied DCP Unit Price Range—2024E Price / DCF $33.27—$38.82 Implied DCP Unit Price Range—2023E and 2024E Price / DCF $33.27—$47.32 49

Preliminary Draft – Confidential Preliminary Valuation of the Common Units Precedent M&A Transaction Analysis ($ in millions, except per unit amounts) Gathering & Processing Transactions Date Transaction EBITDA Announced Acquiror / Target (Seller) Value ($MM) Multiple Sep-22 Antero Midstream / Marcellus G&P System (Crestwood Equity Partners) $205 7.0x Jun-22 Targa Resources / Lucid Energy 3,550 7.5 Jun-22 DCP Midstream / James Lake System (Woodland Midstream II) 160 5.5 May-22 EnLink Midstream / Barnett Gathering and Processing System (Crestwood Equity Partners) 275 4.0 May-22 Crestwood Equity Partners / Sendero Midstream 600 7.0 Apr-22 Delek Logistics Partners / 3Bear Energy 625 8.8 Mar-22 Targa Resources / Southcross Energy Operating 200 4.0 Mar-22 Williams Companies / Trace Midstream 950 6.0 Jan-22 Enterprise Products Partners / Navitas Midstream Partners 3,250 7.8 Oct-21 Crestwood Equity Partners / Oasis Midstream 1,848 8.3 Oct-21 Altus Midstream / BCP Raptor/EagleClaw Midstream 6,248 11.7 Apr-21 EnLink Midstream LLC / Amarillo Rattler JV (Rattler Midstream Partners LP, Amarillo Midstream) 60 6.0 Aug-20 Citizen Energy II LLC / Blue Mountain Midstream LLC (Riviera Resources, Inc.) 111 7.1 Jul-20 CNX Resources Corporation / 46.9% stake in CNX Midstream Partners LP 728 7.7 Feb-20 Equitrans Midstream Corporation / EQM Midstream Partners 1,762 8.3 Mean 7.1x Median 7.1 Min 4.0 Max 11.7 Source: Public filings, FactSet 50

Preliminary Draft – Confidential Preliminary Valuation of the Common Units Precedent M&A Transaction Analysis (cont’d) ($ in millions, except per unit amounts) Natural Gas Transportation Transactions Date Transaction EBITDA Announced Acquiror / Target (Seller) Value ($MM) Multiple Sep-22 DT Midstream / 26.25% Ownership Interest in Millennium Pipeline (National Grid) $552 10.0x Jun-21 Kinder Morgan / Stagecoach Gas Services (Crestwood Equity Partners LP, Consolidated Edison Inc) 857 10.7 Feb-21 ArcLight Capital Partners LLC / 25% Interest in Natural Gas Pipeline Company of America LLC (Kinder Morgan) 1,300 11.2 Jul-20 Berkshire Hathaway Energy / Dominion Energy Natural Gas Transmission and Storage Business 9,700 9.7 Mar-20 ATCO Gas and Pipelines Ltd / Pioneer Pipeline (Tidewater Midstream and Infrastructure Ltd. & TransAlta Corp.) 184 NA Feb-20 Equitrans Midstream Corporation / EQM Midstream Partners, LP 1,762 8.3 Sep-19 NextEra Energy Partners, LP / Meade Pipeline Co LLC 1,280 11.6 Sep-19 Kinder Morgan / Corpus Christi Pipeline Network (Southcross) 76 9.0 Jan-19 NEXUS Gas Transmission, LLC (Enbridge Inc.; DTE Energy Company) / Generation Pipeline LLC 160 14.4 Feb-18 Tallgrass Energy GP, LP / 25.01% interest in Rockies Express Pipeline LLC (Tallgrass Development LP) 1,044 6.4 Nov-17 American Midstream Partners, LP / Trans-Union Interstate Pipeline (ArcLight Capital Partners, LLC) 48 6.5 Jul-17 Blackstone Energy Partners / 32.44% interest in Rover Pipeline (Energy Transfer Partners, LP) 1,571 10.7 TC Pipelines / 49.3% interest in Iroquois Gas Transmission System, LP and 11.8% interest in Portland Natural Gas Transmission (TransCanada Jun-17 765 10.9 Corp.) Apr-17 Tallgrass Energy Partners, LP / 24.99% interest in Rockies Express Pipeline LLC (Tallgrass Development, LP) 1,043 6.6 Mean 9.7x Median 10.0 Min 6.4 Max 14.4 Source: Public filings, FactSet 51

Preliminary Draft – Confidential Preliminary Valuation of the Common Units Precedent M&A Transaction Analysis (cont’d) ($ in millions, except per unit amounts) NGL and NGL-Related Transportation Transactions Date Transaction EBITDA Announced Acquiror / Target (Seller) Value ($MM) Multiple Mar-22 ArcLight / 25% Interest in Gulf Coast Express Pipeline (Targa Resources) $857 11.1x Oct-21 Phillips 66 / Phillips 66 Partners 14,40010.1 Aug-19 Pembina Pipeline Corporation / Cochin Pipeline (Kinder Morgan) 1,54613.0 Jul-19 Altus Midstream / 33.0% interest in Shin Oak Pipeline (Enterprise Products Partners L.P.) 1,33613.8 Oct-17 Blackstone Energy Partners / 25% interest in Grand Prix Pipeline (Targa Resources Corp) 32510.0 Oct-16 Phillips 66 Partners LP / 30 crude oil, refined products and NGL logistics assets (Phillips 66) 1,300 8.7 Jun-16 Riverstone Investment Group LLC / 50% Partner Interest in Utopia Pipeline Project (Kinder Morgan, Inc.) 30012.0 May-16 Phillips 66 Partners LP / Standish Pipeline and remaining 75% in Phillips 66 Sweeny Frac LLC (Phillips 66) 1,033 8.6 Mean 10.9x Median 10.6 Min 8.6 Max 13.8 Source: Public filings, FactSet 52

Preliminary Draft – Confidential Preliminary Valuation of the Common Units A Precedent M&A Transaction Analysis – EV/EBITDA ($ in millions, except per unit amounts) 2022E Adjusted EBITDA $1,749 Relevant EBITDA Multiple 7.25x—9.25x Implied Enterprise Value Based on 2022E Adjusted EBITDA $12,682—$16,180 Less: Preferred Equity1 (271) Less: Net Debt1 (5,331) Less: Noncontrolling Interests1 (25) Implied Equity Value $7,055—$10,553 DCP Units Outstanding 210 Implied DCP Unit Price Range—2022E EBITDA $33.65—$50.34 1. As of December 31, 2022 53

Preliminary Draft – Confidential Preliminary Valuation of the Common Units Premiums Paid Analysis ($ in millions, except per unit amounts) Premium1 Date 1-Day 20-Day Announced Acquiror / Target Consideration Prior Spot VWAP 07/28/22 PBF Energy, Inc. / PBF Logistics LP Cash/Stock-for-Unit (3.0%) 9.5% 07/25/22 Shell USA, Inc. / Shell Midstream Partners, L.P. Cash-for-Unit 23.0% 23.6% 06/02/22 Hartree Partners, LP / Sprague Resources LP Cash-for-Unit 25.2% 27.0% 05/25/22 Höegh LNG Holdings Ltd / Höegh LNG Partners LP Cash-for-Unit 35.0% 42.2% 05/16/22 Diamondback Energy / Rattler Midstream LP Stock-for-Unit 17.3% 10.3% 04/22/22 Ergon, Inc. / Blueknight Energy Partners, L.P. Cash-for-Unit 51.5% 47.5% 12/20/21 BP p.l.c / BP Midstream Partners LP Stock-for-Unit 10.8% 4.0% 10/27/21 Phillips 66 / Phillips 66 Partners LP Stock-for-Unit 4.8% 6.7% 10/04/21 Stonepeak Infrastructure Partners / Teekay LNG Partners LP Cash-for-Unit 8.3% 5.3% 08/23/21 Landmark Dividend / Landmark Infrastructure Partners LP Cash-for-Unit 38.4% 35.0% 03/05/21 Chevron Corporation / Noble Midstream Partners LP Stock-for-Unit 16.7% 18.0% 12/15/20 TC Energy Corporation / TC PipeLines, LP Stock-for-Unit 19.5% 15.5% 07/27/20 CNX Resources Corporation / CNX Midstream Partners Stock-for-Unit 28.1% 3.9% 02/27/20 Equitrans Midstream Corporation / EQM Midstream Partners, LP Stock-for-Unit (1.5%) (5.6%) 12/17/19 Blackstone Infrastructure Partners / Tallgrass Energy LP Cash-for-Unit 56.4% 33.9% 10/01/19 Brookfield Business Partners L.P. / Teekay Offshore Partners L.P. Cash-for-Unit 28.1% 15.1% 09/16/19 Energy Transfer LP / SemGroup Corporation Cash/Unit-for-Share 65.4% 87.3% 08/21/19 Pembina Pipeline Corporation / Kinder Morgan Canada Limited Share-for-Share 37.7% 34.7% 05/10/19 IFM Investors / Buckeye Partners, L.P. Cash-for-Unit 27.5% 23.8% 05/08/19 MPLX LP / Andeavor (Marathon Petroleum Corporation; Andeavor Logistics LP) Unit-for-Unit 1.8% 1.3% 04/02/19 UGI Corporation / AmeriGas Partners, L.P. Cash/Stock-for-Unit 13.5% 22.2% 03/18/19 ArcLight Energy Partners Fund V, L.P. / American Midstream, LP Cash-for-Unit 31.2% 31.2% 02/05/19 SunCoke Energy, Inc. / SunCoke Energy Partners, L.P. Stock-for-Unit 9.3% 19.5% 11/26/18 ArcLight Energy Partners Fund VI, L.P. / TransMontaigne Partners L.P. Cash-for-Unit 12.6% 9.2% 11/08/18 Western Gas Equity Partners, LP / Western Gas Partners, LP Unit-for-Unit 7.6% 62.4% 10/22/18 EnLink Midstream, LLC / EnLink Midstream Partners, LP Unit-for-Unit 1.1% (0.5%) 10/18/18 Valero Energy Corporation / Valero Energy Partners LP Cash-for-Unit 6.0% 9.4% 10/09/18 Antero Midstream GP LP / Antero Midstream Partners LP Cash/Stock-for-Unit 63.7% 54.6% Min (3.0%) (5.6%) Median 18.4% 18.8% All Transactions Mean 22.7% 23.1% Max 65.4% 87.3% Min 6.0% 5.3% Median 27.8% 25.4% Cash-for-Unit Mean 28.6% 25.3% Max 56.4% 47.5% Source: Bloomberg, FactSet, Public filings 1. VWAP premiums paid are calculated by dividing the value of the offer, defined as the exchange ratio multiplied by the closing price of the acquiror’s shares / units on the last trading day prior to announcement plus any cash received, by the 20-trading day VWAP of the target as calculated from the last undisturbed trading day prior to the announcement 54

Preliminary Draft – Confidential Preliminary Valuation of the Common Units Premiums Paid Analysis (cont’d) ($ in millions, except per unit amounts) For Reference Only Summary Results – Cash-for-Unit Transactions 1-Day Prior Spot 20-Day VWAP Unit Price as of 8/17/22 $34.75 $33.88 Historical Merger Premium Range 6.0% — 56.4% 5.3% — 47.5% Implied DCP Unit Price Range $36.84 — $54.36 $35.67 — $49.97 Merger Premium Selected Range 15.0% 30.0% Median-Implied DCP Unit Value $39.96 $44.05 Source: FactSet 55

Preliminary Draft – Confidential Preliminary Valuation of the Common Units ($ in millions, except per unit amounts) Net Present Value of PSX/DCP Operational Efficiencies For Reference Only For the Years Ending December 31, Terminal 2023E 2024E 2025E 2026E 2027E Value Net Operational Efficiencies ($34) $93 $93 $93 $93 $93 Terminal Multiple 8.0x Implied Terminal Value $744 Present Value of Terminal Value @ 13.0% Discount Rate $404 Plus: Present Value of Unlevered Free Cash Flow @ 13.0% Discount Rate 229 Implied NPV of Operational Efficiencies $633 DCP Units Outstanding1 210 Implied Value per Unit $3.02 Value Per NPV of Operational Efficiencies Based on a Range of Discount Rates NPV DCP Unit Present Value @ 10.0% Discount Rate $711 $3.39 Present Value @ 11.0% Discount Rate 684 3.26 Present Value @ 12.0% Discount Rate 657 3.14 Present Value @ 13.0% Discount Rate 633 3.02 Present Value @ 14.0% Discount Rate 609 2.90 Present Value @ 15.0% Discount Rate 586 2.80 Source: DCP Management 1. Includes 117.8mm common units held by DCP Midstream, LLC and DCP Midstream GP, LP, and 1.3mm phantom and performance units 56

Preliminary Draft – Confidential VI. Illustrative DCP Unitholder Tax Analysis

Preliminary Draft – Confidential Illustrative DCP Unitholder Tax Analysis DCP Unitholder Tax Analysis @ Illustrative Offer Price ($38.00 / unit) – Assumptions (Allowing for Tax Losses Offset) â—¼ï€ PricewaterhouseCoopers LLP (“PwC”) provided the DCP unaffiliated unitholders tax liability by unit acquisition date information, which included the following:ï,„ï€ Adjusted Basis – Represents the weighted average price acquired, plus cumulative income, less cumulative distributions and DD&A from the acquisition date to Dec 2021ï,„ï€ §751 Gain – Recharacterization of gain or loss on the sale of a partnership interest from capital to ordinary on §751 property owned by the partnershipï,„ï€ Net Ordinary Gain / (Loss) per Unit – Calculated as §751 Gain less Passive Loss Carryover assuming Passive Loss Carryover amounts are 100% available to offset Ordinary Gainsï,„ï€ Net Capital Gain / (Loss) per Unit – Calculated as Total Gain / (Loss) per Unit less §751 Gain ï,„ï€ Estimated Taxes – Calculated based on the Net Ordinary Gain / (Loss) per Unit assuming a 37.0% tax rate and the Net Capital Gain / (Loss) per Unit assuming a 20.0% tax rate Ordinary Gain / (Loss) Total Gain / (Loss) Per Unit Per Unit Capital Gain / (Loss) Per Unit Tax Liability Per Unit Average A B C = A—B D E F = D + E C D G = C – D H = F * T1 I = G * T2 J = H + I % of Total Purchase Offer Adjusted Total Gain / Carryover Net Ordinary Total Gain / Net Capital Ordinary Tax Capital Tax Total Tax Year DCP Units Units Price Price Basis (Loss) 751 Gain Passive Losses Gain / (Loss) (Loss) 751 Gain Gain / (Loss) Liability Liability Liability 2005 270,466 0.3% $22.26 $38.00 ($8.11) $46.11 $39.86 ($0.25) $39.61 $46.11 $39.86 $6.25 $14.65 $1.25 $15.90 2006 211,417 0.2% 27.41 38.00 (5.73) 43.73 39.84 (0.25) 39.59 43.73 39.84 3.89 14.65 0.78 15.43 2007 59,522 0.1% 38.33 38.00 1.22 36.78 40.05 (0.86) 39.19 36.78 40.05 (3.27) 14.50 (0.65) 13.85 2008 796,037 0.8% 15.39 38.00 (10.08) 48.08 38.68 (0.26) 38.42 48.08 38.68 9.40 14.22 1.88 16.10 t se 2009 732,186 0.7% 17.63 38.00 (4.94) 42.94 38.72 (0.27) 38.45 42.94 38.72 4.22 14.23 0.84 15.07 f f 2010 433,527 0.4% 31.70 38.00 3.10 34.90 38.52 (1.31) 37.21 34.90 38.52 (3.62) 13.77 (0.72) 13.04 O s 2011 336,480 0.3% 38.71 38.00 7.30 30.70 37.87 (3.61) 34.26 30.70 37.87 (7.16) 12.68 (1.43) 11.24 Losse 2012 624,009 0.6% 41.45 38.00 13.06 24.94 37.25 (3.73) 33.52 24.94 37.25 (12.31) 12.40 (2.46) 9.94 2013 1,518,266 1.5% 44.98 38.00 10.53 27.47 36.23 (12.39) 23.85 27.47 36.23 (8.76) 8.82 (1.75) 7.07 Tax 2014 4,317,028 4.2% 48.17 38.00 7.88 30.12 36.08 (17.11) 18.97 30.12 36.08 (5.96) 7.02 (1.19) 5.83 or 2015 2,304,183 2.2% 31.43 38.00 (0.92) 38.92 33.58 (12.45) 21.13 38.92 33.58 5.33 7.82 1.07 8.89 f ng 2016 2,139,528 2.1% 26.57 38.00 (1.29) 39.29 31.89 (11.28) 20.60 39.29 31.89 7.41 7.62 1.48 9.10 2017 1,740,235 1.7% 33.50 38.00 4.54 33.46 34.18 (15.42) 18.76 33.46 34.18 (0.72) 6.94 (0.14) 6.80 Allowi 2018 5,404,934 5.2% 32.57 38.00 9.24 28.76 30.51 (13.35) 17.16 28.76 30.51 (1.75) 6.35 (0.35) 6.00 2019 10,563,654 10.3% 24.85 38.00 8.31 29.69 25.90 (9.80) 16.10 29.69 25.90 3.80 5.96 0.76 6.72 2020 34,033,552 33.0% 9.52 38.00 2.31 35.69 15.91 (2.87) 13.04 35.69 15.91 19.78 4.83 3.96 8.78 2021 37,515,444 36.4% 23.64 38.00 15.05 22.95 14.45 (5.69) 8.76 22.95 14.45 8.50 3.24 1.70 4.94 Total / Wtd. Avg. 103,000,468 100.0% $21.41 $38.00 $8.07 $29.93 $20.11 ($6.44) $13.67 $29.93 $20.11 $9.82 $5.06 $1.96 $7.02 Source: PwC 57

Preliminary Draft – Confidential Illustrative DCP Unitholder Tax Analysis DCP Unitholder Tax Analysis @ Illustrative Offer Price ($38.00 / unit) – Assumptions (No Tax Losses Offset) â—¼ï€ PricewaterhouseCoopers LLP (“PwC”) provided the DCP unaffiliated unitholders tax liability by unit acquisition date information, which included the following:ï,„ï€ Adjusted Basis – Represents the weighted average price acquired, plus cumulative income, less cumulative distributions and DD&A from the acquisition date to Dec 2021ï,„ï€ §751 Gain – Recharacterization of gain or loss on the sale of a partnership interest from capital to ordinary on §751 property owned by the partnershipï,„ï€ Net Ordinary Gain / (Loss) per Unit – Calculated as §751 Gain less Passive Loss Carryover assuming Passive Loss Carryover amounts are 100% available to offset Ordinary Gainsï,„ï€ Net Capital Gain / (Loss) per Unit – Calculated as Total Gain / (Loss) per Unit less §751 Gain ï,„ï€ Estimated Taxes – Calculated based on the Net Ordinary Gain / (Loss) per Unit assuming a 37.0% tax rate and the Net Capital Gain / (Loss) per Unit assuming a 20.0% tax rate Ordinary Gain / (Loss) Total Gain / (Loss) Per Unit Per Unit Capital Gain / (Loss) Per Unit Tax Liability Per Unit Average A B C = A—B D E F = D + E C D G = C – D H = F * T1 I = G * T2 J = H + I % of Total Purchase Offer Adjusted Total Gain / Carryover Net Ordinary Total Gain / Net Capital Ordinary Tax Capital Tax Total Tax Year DCP Units Units Price Price Basis (Loss) 751 Gain Passive Losses Gain / (Loss) (Loss) 751 Gain Gain / (Loss) Liability Liability Liability 2005 270,466 0.3% $22.26 $38.00 ($8.11) $46.11 $39.86 ($0.25) $39.61 $46.11 $39.86 $6.25 $14.65 $1.25 $15.90 2006 211,417 0.2% 27.41 38.00 (5.73) 43.73 39.84 (0.25) 39.59 43.73 39.84 3.89 14.65 0.78 15.43 2007 59,522 0.1% 38.33 38.00 1.22 36.78 40.05 (0.86) 39.19 36.78 40.05 (3.27) 14.50—14.50 2008 796,037 0.8% 15.39 38.00 (10.08) 48.08 38.68 (0.26) 38.42 48.08 38.68 9.40 14.22 1.88 16.10 2009 732,186 0.7% 17.63 38.00 (4.94) 42.94 38.72 (0.27) 38.45 42.94 38.72 4.22 14.23 0.84 15.07 2010 433,527 0.4% 31.70 38.00 3.10 34.90 38.52 (1.31) 37.21 34.90 38.52 (3.62) 13.77—13.77 ffset 2011 336,480 0.3% 38.71 38.00 7.30 30.70 37.87 (3.61) 34.26 30.70 37.87 (7.16) 12.68—12.68 O 2012 624,009 0.6% 41.45 38.00 13.06 24.94 37.25 (3.73) 33.52 24.94 37.25 (12.31) 12.40—12.40 es 2013 1,518,266 1.5% 44.98 38.00 10.53 27.47 36.23 (12.39) 23.85 27.47 36.23 (8.76) 8.82—8.82 Loss 2014 4,317,028 4.2% 48.17 38.00 7.88 30.12 36.08 (17.11) 18.97 30.12 36.08 (5.96) 7.02—7.02 Tax 2015 2,304,183 2.2% 31.43 38.00 (0.92) 38.92 33.58 (12.45) 21.13 38.92 33.58 5.33 7.82 1.07 8.89 o 2016 2,139,528 2.1% 26.57 38.00 (1.29) 39.29 31.89 (11.28) 20.60 39.29 31.89 7.41 7.62 1.48 9.10 N 2017 1,740,235 1.7% 33.50 38.00 4.54 33.46 34.18 (15.42) 18.76 33.46 34.18 (0.72) 6.94—6.94 2018 5,404,934 5.2% 32.57 38.00 9.24 28.76 30.51 (13.35) 17.16 28.76 30.51 (1.75) 6.35—6.35 2019 10,563,654 10.3% 24.85 38.00 8.31 29.69 25.90 (9.80) 16.10 29.69 25.90 3.80 5.96 0.76 6.72 2020 34,033,552 33.0% 9.52 38.00 2.31 35.69 15.91 (2.87) 13.04 35.69 15.91 19.78 4.83 3.96 8.78 2021 37,515,444 36.4% 23.64 38.00 15.05 22.95 14.45 (5.69) 8.76 22.95 14.45 8.50 3.24 1.70 4.94 Total / Wtd. Avg. 103,000,468 100.0% $21.41 $38.00 $8.07 $29.93 $20.11 ($6.44) $13.67 $29.93 $20.11 $9.82 $5.06 $2.10 $7.16 Source: PwC 58

Units (in Millions) . 0 2 . 4 . 6 . . 8 10 . . 12 14 . 0 0 0 0 0 0 0 0 DCP $— $0.18 $0.35 $0.53 $0.70 $0.88 $1.06 $1.23 Illustrative $1.41 $1.59 Unitholder $1.76 $1.94 $2.11 $2.29 Tax DCP $2.47 $2.64 $2.82 Fifth First $2.99 Total ThirdFourth $3.17 Second $3.35 Weighted $3.52 Decile Decile Decile $3.70 Taxes $3.88 Decile Decile Analysis $4.05 $4.23 @ $4.40 Average $4.58 Payable $4.76 Implied Unitholder $4.93$5.11by $5.28 $5.46 $5.64 Taxes Tax $5.81 $5.99 @$6.17 Illustrative $6.34 $6.52 Unaffiliated 37 $6.69 . Net $6.87 $7.05 0% Offer $7.22 Taxes $7.40$7.58 Analysis Paid $7.75 $7.93 $ $ $ $ $ Tax per Unitholders 6 . . 5 . 4 4 . 3 . 59 $8.10 ( Price DCP $8.28 $ 01 68 35 21 37( $8.46— — ——Ordinary$ Unit $8.63 MM) $ $ $ $ $ $8.81 6 6 5 4 4 $8.98 . . . . . 38 $9.16 82 01 68 35 21 Liability Gain . $9.34 / 00 $9.51 /$9.69 20 $9.87 .. $10.04 $10.22 Deciles 0% $10.39 (unit) $10.57 $ $10.75 Ninth Sixth – $10.92 Tenth Eighth $11.10 Seventh per $11.27 Capital $11.45 Decile $11.63 Decile Decile Decile $11.80 Decile unit) $11.98 $12.16 Gain $12.33Allowing $12.51 $12.68 $12.86 for $13.04 $13.21 $13.39 $13.56 Tax $13.74 $13.92 $14.09 $14.27 Preliminary $14.45 $14.62 $14.80 Losses $14.97 Draft $15.15 –$15.33 $15.50 $ $ $15.68 10 8 $ $ $ $15.85 . . 8 7 6 $16.03 07 73 . . . Offset $16.21-— 08 21 82 $16.38 $ -—$16.56 $ $ $$$ $$16.74 . 7 16 10 723 . . . 8 . 8 7 . Confidential $16.91 . 2 02 97 07 73 08 21

Units (in Millions) . 0 . 2 4 . 6 . . 8 10 . . 12 14 . 0 0 0 0 0 0 0 0 DCP $— $0.18 $0.35 $0.53 $0.70 $0.88 $1.06 $1.23 Illustrative $1.41 $1.59 Unitholder $1.76 $1.94 $2.11 $2.29 Tax DCP $2.47 $2.64 $2.82 Fifth First $2.99 Total ThirdFourth $3.17 Second $3.35 Weighted $3.52 Decile Decile Decile $3.70 Taxes $3.88 Decile Decile Analysis $4.05 $4.23 @ $4.40 Average $4.58 Payable $4.76 Implied Unitholder $4.93$5.11by $5.28 $5.46 $5.64 Taxes Tax $5.81 $5.99 @$6.17 Illustrative $6.34 $6.52 Unaffiliated 37 $6.69 . Net $6.87 $7.05 0% Offer $7.22 Taxes $7.40$7.58 Analysis Paid $7.75 $7.93 $ $ $ $ $ Tax per Unitholders . 6 5 . . 4 4 . . 3 60 $8.10 ( Price DCP $8.28 $ 26 69 95 25 50( $8.46--— —Ordinary$ Unit $8.63 MM) $ $ $ $ $ $8.81 6 6 5 4 4 $8.98 . . . . . 38 $9.16 92 26 69 95 25 Liability Gain . $9.34 / 00 $9.51 /$9.69 20 $9.87 . $10.04 $10.22 Deciles 0% $10.39( unit) $10.57 $ $10.75 Ninth Sixth – $10.92 Tenth Eighth $11.10 Seventh per $11.27 Capital No $11.45 $11.63 Decile Decile Decile Decile $11.80 Decile unit) $11.98 Tax $12.16 Gain $12.33 $12.51 $12.68 $12.86 $13.04 $13.21 Losses $13.39 $13.56 $13.74 $13.92 $14.09 $14.27 Preliminary $14.45 Offset $14.62 $14.80 $14.97 Draft $15.15 –$15.33 $15.50 $ $15.68 9 $ $ $ $ $15.85 . 8 8 7 6 $16.03 86 . . . . $16.21- 90 12 37 92 $16.38 $— — —$16.56 $ $ $ $ $ $ $16.74 . 7 16 737 . 9 . . 8 . 8 7 . Confidential $16.91 4 . 16 97 86 90 12 37

( $ ( $ ( $ $ $ $ . 30 . 20 . 10 10 20 30 . . . 00) 00) 00) — $ 00 00 00 ($24.08) ($3.04) ($2.55) First ($2.82) ($3.33) Precedent ($4.75) $— Decile $2.49 Illustrative ($5.75) $3.37 ($18.94) ($2.59) ($2.14) Taxable $0.00 DCP Second ($2.64) $3.04($1.95) $2.49 MLP Decile ($0.68) MLP $4.21($14.61) A ($2.34) Buy ($1.57) -Third $0.58($1.23) In MLP ($1.43) $3.23B Decile $2.52 Unitholder ($0.16) $4.35 ($11.18) ($1.08) MLP ($1.44) C $0.95 Tax Fourth ($0.95)$3.61 Estimated Unitholder ($1.34) $2.58 MLP Decile $0.15 $5.68Cash Tax D ($2.44)($0.03) ($0.87) Tax Fifth $1.22MLP ($0.56) Analysis $3.70 E ($1.25) Impact 61 Decile $2.63 $0.31 $6.01 $0.60 (Benefit) MLP $0.31 / F ($0.44) Sixth $1.99($0.36) $4.00 ($1.13) MLP Decile $3.18 G $0.37 $6.82 Expense $1.89$0.71 ($0.14) per MLP $2.52Seventh ($0.07) H ($0.99) $4.18 Unit $3.20 Decile $0.39 MLP $7.21 I $4.47 $1.46 $1.13 Eighth $3.84 $0.01 DCP $4.64 ($0.55) $3.34 Decile $0.39 $8.08 $5.71 $2.00 $1.54 Ninth $5.75$1.02 Preliminary $5.05 ($0.11) Decile $3.72 Draft $0.41$8.73 – $13.49 $3.33 $2.45 Tenth $6.94$8.51 $5.70 $0.02 Decile $3.77 $0.44 Confidential $10.07

(225 . (175 . . (125 . (75 . (25 25 75 125 . 0% 0% . 0% . 0%) 0%) 0%) 0%) 0%) (100.3%) (25.5%) (7.2%) First (6.9%) Precedent (30.9%) —%(105.6%) Illustrative Decile 6.0% (173.1%) 8.9% (78.9%) (21.7%) Taxable (6.1%) 0.0% DCP Second (24.5%)16.5% (43.3%) MLP 6.0% Decile (20.5%) MLP 11.1% A (60.9%) (19.6%) Buy Third (4.5%) 1.4%—In (11.4%) MLP 17.5% Estimated(31.8%) B Decile 6.1% Unitholder (4.8%) 11.5% (46.6%) Cash MLP (9.1%)(4.1%) Tax C Fourth 2.3% Tax (8.8%) 19.5% Unitholder (29.7%) 6.2% MLP Decile 4.4% D 14.9% Tax (10.2%) (0.3%) (Benefit) (2.5%) Fifth 3.0% / MLP (5.2%) Analysis 20.1% E (27.9%) Impact 62 Decile 6 9 ..3 .2% %15.8% MLP 2.5% Expense 2.6% F (1.3%) Sixth 4.9% per (3.3%) 21.7% (cont’d) (25.2%) MLP 7.7% Decile 11.1% Unit G 17.9%7.9% as 6.0% (0.4%) % MLP 6.2%Seventh (0.6%) of H (22.0%) 22.7%7.7% Decile 11.7% 19.0% Offer MLP I 18.6% 12.3% 3.2% Eighth 9.4% 0.1% DCP 25.2% Value (12.2%) 8.0% Decile 11.9% 21.3% 23.8% 16.8% 4.4% Ninth 14.1% Preliminary 9.5% 27.3%(2.4%) Decile 9.0% Draft 12.3% 23.0% –56.2% 28.0% 6.9% Tenth 17.0%79.0% 30.9% 0.5% Decile 9.1% Confidential 13.2% 26.5%

Preliminary Draft – Confidential Appendix

Preliminary Draft – Confidential A. Weighted Average Cost of Capital Analysis

Preliminary Draft – Confidential Weighted Average Cost of Capital Analysis DCP Common Units – Capital Asset Pricing Model ($ in millions, except per unit/share amounts) Unit/Share Price Market Equity Total Debt and Total Debt / Adjusted Unlevered 1 2 Partnership/Corporation 10/28/22 Value Preferred Equity Total Capitalization Beta Beta Antero Midstream Corporation $10.49 $5,076 $3,370 39.9% 0.77 0.51 Crestwood Equity Partners LP 30.64 3,786 3,617 48.9% 0.53 0.32 EnLink Midstream, LLC 11.68 5,743 4,555 44.2% 1.02 0.63 Equitrans Midstream Corporation 8.20 3,587 7,110 66.5% 0.82 0.32 Hess Midstream Partners LP 28.65 6,876 2,957 30.1% 0.67 0.51 Kinetik Holdings Inc. 36.29 4,899 3,492 41.6% 2.21 1.42 CAPM ONEOK, Inc. 59.72 26,792 13,769 33.9% 0.99 0.70 Summit Midstream Partners, LP 19.95 209 1,730 89.2% 1.06 0.16 Targa Resources Corp. 67.16 15,522 11,011 41.5% 0.96 0.61 Western Midstream Partners, LP 28.41 11,048 6,725 37.8% 0.88 0.61 Mean 47.4% 0.99 0.58 Median 41.6% 0.92 0.56 DCP Midstream, LP $39.50 $8,281 $6,038 42.2% 0.77 0.51 Risk-free Rate 3 4.4% Unlevered Beta 0.51 Debt and Preferred / Total Capitalization 42.2% Adjusted Levered Equity Beta 0.77 DCP Midstream Cost of Debt7 Supply-Side MRP Historical MRP WACC Market Risk Premium (“MRP”) 4 6.2% 7.5% Yield-to-Worst Small Company Risk Premium 5 0.7% DCP Midstream 5.600% Senior Notes Due 2044 6.57% Equity Cost of Capital 6 9.9% 10.8% U.S. Treasury Note Due 2042 4.38% Pre-Tax Cost of Debt 7 6.5% Less: U.S. Treasury Note Due 2044 4.47% After-Tax Cost of Debt 8 4.6% (0.09%) WACC 7.6% 8.2% DCP Midstream Implied 20-Year Cost of Debt 6.48% Equity Cost of Capital Sensitivity WACC Sensitivity (Supply-Side / Historical) (Supply-Side / Historical) Debt and Preferred / Total Capitalization Debt and Preferred / Total Capitalization 45.0% 50.0% 55.0% 60.0% 65.0% 45.0% 50.0% 55.0% 60.0% 65.0% ed 0.45 7.3% / 7.8% 7.2% / 7.7% 7.1% / 7.6% 7.1% / 7.5% 7.0% / 7.5% ed 0.45 9.5% / 10.4% 9.9% / 10.8% 10.3% / 11.3% 10.8% / 12.0% 11.5% / 12.8% r 0.50 7.5% / 8.1% 7.5% / 8.0% 7.4% / 7.9% 7.3% / 7.8% 7.3% / 7.8% r 0.50 10.0% / 11.0% 10.4% / 11.4% 10.9% / 12.0% 11.5% / 12.8% 12.3% / 13.7% Beta 0.55 7.8% / 8.4% 7.7% / 8.3% 7.7% / 8.2% 7.6% / 8.1% 7.5% / 8.1% Beta 0.55 10.5% / 11.6% 10.9% / 12.1% 11.5% / 12.7% 12.1% / 13.5% 13.0% / 14.6% nleve U 0.60 8.1% / 8.7% 8.0% / 8.6% 7.9% / 8.5% 7.8% / 8.5% 7.8% / 8.4% nleve U 0.60 11.0% / 12.1% 11.4% / 12.7% 12.0% / 13.4% 12.8% / 14.3% 13.7% / 15.4% 0.65 8.4% / 9.1% 8.3% / 9.0% 8.2% / 8.9% 8.1% / 8.8% 8.0% / 8.7% 0.65 11.5% / 12.7% 12.0% / 13.4% 12.6% / 14.1% 13.4% / 15.1% 14.4% / 16.3% 1.Source: Predicted raw betas from FactSet; Adjusted Equity Beta calculated as: (0.67) × Raw Beta +(0.33) × 1.0 2.Unlevered Beta calculated as: Adjusted Equity Beta × (E/(E + D × (1-T)); Assumes corporate tax rate of 29.6% for partnerships and 21.0% for corporations 3.20-year Treasury as of October 28, 2022 4.Source: Duff & Phelps 5.Decile: Mid Cap (5) with equity value range of $6,743.4 million to $13,177.8 million 6.Equity Cost of Capital calculated as: Risk-free rate + (Levered Equity Beta × Market Risk Premium) + Small Company Risk Premium 7.Implied DCP 20-year cost of debt based on the yield-to-worst of DCP’s 5.600% Senior Notes Due 2044 adjusted for 20-year maturity using the implied yield spread from relevant U.S. treasury notes 8.Assumes U.S. individual partnership income tax structure through 2025 of 80.0% of income taxable at highest tax rate of 37.0%, or 29.6% 63

Preliminary Draft – Confidential Weighted Average Cost of Capital Analysis DCP Common Units – Total Expected Market Return ($ in millions, except per unit/share amounts) Unit/Share Price Market Equity Distribution/Dividend Total Partnership/Corporation 10/28/22 Value Current Yield Growth Return Antero Midstream Corporation $10.49 $5,076 8.6% —% 8.6% Crestwood Equity Partners LP 30.64 3,786 8.6% 5.0% 13.5% EnLink Midstream, LLC 11.68 5,743 3.9% 10.0% 13.9% Equitrans Midstream Corporation 8.20 3,587 7.3% 2.4% 9.7% Total Hess Midstream Partners LP 28.65 6,876 7.8% 4.0% 11.8% Expected Kinetik Holdings Inc. 36.29 4,899 8.3% 4.2% 12.5% Market ONEOK, Inc. 59.72 26,792 6.3% 3.0% 9.3% Return Targa Resources Corp. 67.16 15,522 2.1% 5.0% 7.1% Western Midstream Partners, LP 28.41 11,048 7.0% 11.2% 18.3% Mean 11.6% Median 11.8% DCP Midstream, LP $39.50 $8,281 4.4% 3.1% 7.5% WACC Debt and Preferred / Total Capitalization 42.2% Market Required Equity Return 11.8% WACC Pre-Tax Cost of Debt1 6.5% After-Tax Cost of Debt2 4.6% DCP Cost of Debt1 WACC 8.7% Yield-to-Worst DCP Midstream 5.600% Senior Notes Due 2044 6.57% U.S. Treasury Note Due 2042 4.38% Less: U.S. Treasury Note Due 2044 4.47% (0.09%) DCP Midstream Implied 20-Year Cost of Debt 6.48% 1. Implied DCP 20-year cost of debt based on the yield-to-worst of DCP’s 5.600% Senior Notes Due 2044 Adjusted for 20-year maturity using the implied yield spread from relevant U.S. treasury notes 2. Assumes U.S. individual partnership income tax structure through 2025 of 80.0% of income taxable at highest tax rate of 37.0%, or 29.6% 64

Preliminary Draft – Confidential B. Supplemental Valuation Materials

Preliminary Draft – Confidential Supplemental Valuation Materials DCP Valuation – Commodity Price Sensitivity Commodity Sensitivity DCP Value per Unit Impact1 2023 ($0.54) $0.54 +/- $0.02 NGLs (3% of 2023E DCP 2024 NGL Price) ($0.57) $0.57 2023 +/- $0.05 ($0.13) $0.13 Natural Gas (1% of 2023E DCP 2024 HHUB Price) ($0.16) $0.16 2023 +/- $5.00 ($0.71) $0.71 Crude (7% of 2023E DCP 2024 WTI Price) ($0.81) $0.81 Source: DCP Management 1. Assumes EV/EBITDA multiples of 8.75x 2023E EBITDA and 8.50x 2024E EBITDA representing the midpoint of Evercore’s Peer Group Trading Analysis 65

Preliminary Draft – Confidential B NYMEX Strip Pricing

Preliminary Draft – Confidential Supplemental Valuation Materials – NYMEX Strip Pricing B Discounted Cash Flow Analysis ($ in millions, except per unit amounts) Summary Results For the Years Ending December 31, Exit Perpetuity 2023E 2024E 2025E 2026E 2027E Multiple Growth Adjusted EBITDA $1,698 $1,624 $1,566 $1,524 $1,499 $1,499 $1,499 Less: Tax Depreciation and Amortization¹ (14,238) (154) (127) (118) (116) (125) EBIT ($12,540) $1,470 $1,439 $1,406 $1,384 $1,374 Less: Cash Taxes — (87) (85) (104) (102) (508) EBIAT ($12,540) $1,383 $1,354 $1,302 $1,281 $866 Plus: Tax Depreciation and Amortization 14,238 154 127 118 116 125 Less: Maintenance Capex (150) (150) (125) (125) (125) (125) Less: Growth Capex (125) (50) (50) (50) (50) —Unlevered Free Cash Flow $1,423 $1,337 $1,306 $1,245 $1,222 $866 EBITDA Multiple / Perpetuity Growth Rate 8.75x 1.0% Implied Terminal Value $13,119 $12,492 Present Value of Terminal Value @ 8.0% Discount Rate $8,928 $8,181 Plus: Present Value of Unlevered Free Cash Flow @ 8.0% Discount Rate 5,453 Implied Enterprise Value $14,381 $13,634 Less: Preferred Equity2 ($271) Less: Net Debt2 (5,364) Less: Noncontrolling Interests2 (25) Implied Equity Value $8,721 $7,974 DCP Units Outstanding3 210 Implied Value per Unit $41.60 $38.03 Sensitivity Analysis Terminal Exit Multiple Perpetuity Growth Rate 7.75x 8.25x 8.75x 9.25x 9.75x —% 0.5% 1.0% 1.5% 2.0% 7.0% $39.08 $41.63 $44.18 $46.73 $49.28 7.0% $40.23 $43.58 $47.49 $52.10 $57.64 7.5% 37.89 40.38 42.87 45.37 47.86 7.5% 36.28 39.12 42.40 46.22 50.74 WACC 8.0% 36.73 39.17 41.60 44.03 46.47 WACC 8.0% 32.82 35.25 38.03 41.24 44.99 8.5% 35.60 37.98 40.36 42.73 45.11 8.5% 29.76 31.86 34.25 36.97 40.12 9.0% 34.50 36.82 39.14 41.47 43.79 9.0% 27.04 28.87 30.93 33.27 35.94 66 1. 2023E tax DD&A assumes 80% bonus depreciation calculated as the midpoint of the enterprise value range plus 2023E capital expenditures 2. Per DCP Management as of December 31, 2022 3. Includes 117.8mm common units held by DCP Midstream, LLC and DCP Midstream GP, LP, and 1.3mm phantom and performance units

Preliminary Draft – Confidential Supplemental Valuation Materials – NYMEX Strip Pricing B Peer Group Trading Analysis – EV/EBITDA ($ in millions, except per unit amounts) 2023E Adjusted EBITDA $1,698 Relevant EBITDA Multiple 8.25x—9.25x Implied Enterprise Value Based on 2023E Adjusted EBITDA $14,009—$15,707 Less: Preferred Equity1 (271) Less: Net Debt1 (5,364) Less: Noncontrolling Interests1 (25) Implied Equity Value $8,349—$10,047 DCP Units Outstanding 210 Implied DCP Unit Price Range—2023E EBITDA $39.82—$47.92 2024E Adjusted EBITDA $1,624 Relevant EBITDA Multiple 8.0x—9.0x Implied Enterprise Value Based on 2024E Adjusted EBITDA $12,989—$14,613 Less: Preferred Equity1 (271) Less: Net Debt1 (5,364) Less: Noncontrolling Interests1 (25) Implied Equity Value $7,329—$8,953 DCP Units Outstanding 210 Implied DCP Unit Price Range—2024E EBITDA $34.96—$42.70 Implied DCP Unit Price Range—2023E and 2024E EBITDA $34.96—$47.92 1. As of December 31, 2022 67

Preliminary Draft – Confidential Supplemental Valuation Materials – NYMEX Strip Pricing B Peer Group Trading Analysis – Price/DCF per LP Unit ($ in millions, except per unit amounts) 2023E DCF / LP Unit $5.91 Relevant Multiple 7.0x—8.0x Implied DCP Unit Price Range—2023E Price / DCF $41.37—$47.28 2024E DCF / LP Unit $5.77 Relevant Multiple 6.0x—7.0x Implied DCP Unit Price Range—2024E Price / DCF $34.59—$40.36 Implied DCP Unit Price Range—2023E and 2024E Price / DCF $34.59—$47.28 68

Preliminary Draft – Confidential Supplemental Valuation Materials – NYMEX Strip Pricing B Precedent M&A Transaction Analysis – EV/EBITDA ($ in millions, except per unit amounts) 2022E Adjusted EBITDA $1,717 Relevant EBITDA Multiple 7.25x—9.25x Implied Enterprise Value Based on 2022E Adjusted EBITDA $12,446—$15,879 Less: Preferred Equity1 (271) Less: Net Debt1 (5,364) Less: Noncontrolling Interests1 (25) Implied Equity Value $6,785—$10,219 DCP Units Outstanding 210 Implied DCP Unit Price Range—2022E EBITDA $32.37—$48.74 1. As of December 31, 2022 69

Preliminary Draft – Confidential C Higher Commodity Prices

Preliminary Draft – Confidential Supplemental Valuation Materials – Higher Commodity Prices C Discounted Cash Flow Analysis ($ in millions, except per unit amounts) Summary Results For the Years Ending December 31, Exit Perpetuity 2023E 2024E 2025E 2026E 2027E Multiple Growth Adjusted EBITDA $1,860 $1,718 $1,706 $1,690 $1,666 $1,666 $1,666 Less: Tax Depreciation and Amortization¹ (15,798) (154) (127) (118) (116) (125) EBIT ($13,938) $1,564 $1,579 $1,571 $1,550 $1,541 Less: Cash Taxes — (93) (93) (116) (115) (570) EBIAT ($13,938) $1,472 $1,486 $1,455 $1,435 $971 Plus: Tax Depreciation and Amortization 15,798 154 127 118 116 125 Less: Maintenance Capex (150) (150) (125) (125) (125) (125) Less: Growth Capex (125) (50) (50) (50) (50) —Unlevered Free Cash Flow $1,585 $1,425 $1,438 $1,398 $1,376 $971 EBITDA Multiple / Perpetuity Growth Rate 8.75x 1.0% Implied Terminal Value $14,574 $14,004 Present Value of Terminal Value @ 8.0% Discount Rate $9,919 $9,171 Plus: Present Value of Unlevered Free Cash Flow @ 8.0% Discount Rate 6,022 Implied Enterprise Value $15,941 $15,194 Less: Preferred Equity2 ($271) Less: Net Debt2 (5,364) Less: Noncontrolling Interests2 (25) Implied Equity Value $10,281 $9,533 DCP Units Outstanding3 210 Implied Value per Unit $49.04 $45.47 Sensitivity Analysis Terminal Exit Multiple Perpetuity Growth Rate 7.75x 8.25x 8.75x 9.25x 9.75x —% 0.5% 1.0% 1.5% 2.0% 7.0% $46.25 $49.08 $51.91 $54.75 $57.58 7.0% $47.93 $51.69 $56.06 $61.24 $67.45 7.5% 44.92 47.69 50.46 53.23 55.99 7.5% 43.51 46.69 50.36 54.65 59.72 WACC 8.0% 43.63 46.34 49.04 51.74 54.45 WACC 8.0% 39.63 42.36 45.47 49.07 53.27 8.5% 42.38 45.02 47.66 50.30 52.94 8.5% 36.20 38.56 41.23 44.29 47.81 9.0% 41.15 43.73 46.31 48.90 51.48 9.0% 33.16 35.21 37.52 40.14 43.13 70 1. 2023E tax DD&A assumes 80% bonus depreciation calculated as the midpoint of the enterprise value range plus 2023E capital expenditures 2. Per DCP Management as of December 31, 2022 3. Includes 117.8mm common units held by DCP Midstream, LLC and DCP Midstream GP, LP, and 1.3mm phantom and performance units
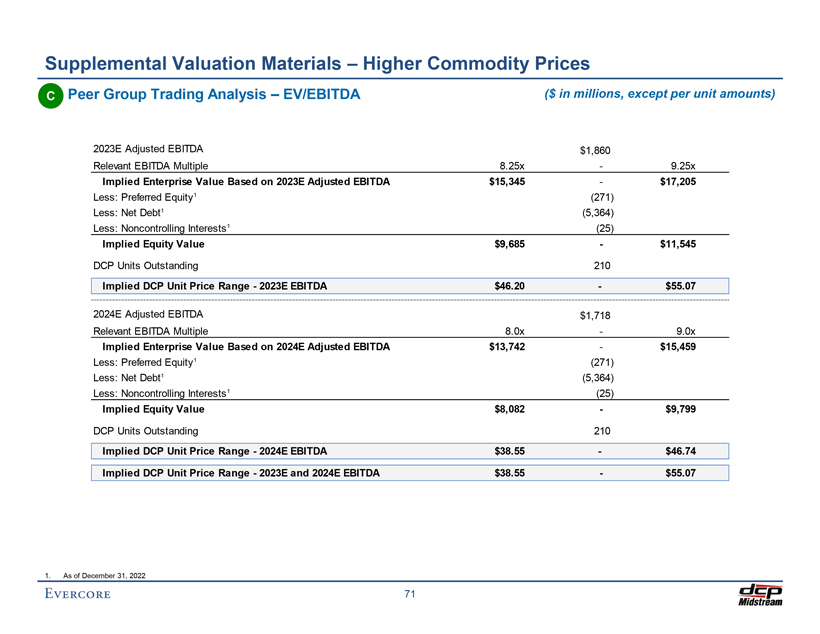
Preliminary Draft – Confidential Supplemental Valuation Materials – Higher Commodity Prices C Peer Group Trading Analysis – EV/EBITDA ($ in millions, except per unit amounts) 2023E Adjusted EBITDA $1,860 Relevant EBITDA Multiple 8.25x—9.25x Implied Enterprise Value Based on 2023E Adjusted EBITDA $15,345—$17,205 Less: Preferred Equity1 (271) Less: Net Debt1 (5,364) Less: Noncontrolling Interests1 (25) Implied Equity Value $9,685—$11,545 DCP Units Outstanding 210 Implied DCP Unit Price Range—2023E EBITDA $46.20—$55.07 2024E Adjusted EBITDA $1,718 Relevant EBITDA Multiple 8.0x—9.0x Implied Enterprise Value Based on 2024E Adjusted EBITDA $13,742—$15,459 Less: Preferred Equity1 (271) Less: Net Debt1 (5,364) Less: Noncontrolling Interests1 (25) Implied Equity Value $8,082—$9,799 DCP Units Outstanding 210 Implied DCP Unit Price Range—2024E EBITDA $38.55—$46.74 Implied DCP Unit Price Range—2023E and 2024E EBITDA $38.55—$55.07 1. As of December 31, 2022 71

Preliminary Draft – Confidential Supplemental Valuation Materials – Higher Commodity Prices C Peer Group Trading Analysis – Price/DCF per LP Unit ($ in millions, except per unit amounts) 2023E DCF / LP Unit $6.71 Relevant Multiple 7.0x—8.0x Implied DCP Unit Price Range—2023E Price / DCF $46.98—$53.69 2024E DCF / LP Unit $6.23 Relevant Multiple 6.0x—7.0x Implied DCP Unit Price Range—2024E Price / DCF $37.36—$43.59 Implied DCP Unit Price Range—2023E and 2024E Price / DCF $37.36—$53.69 72

Preliminary Draft – Confidential Supplemental Valuation Materials – Higher Commodity Prices C Precedent M&A Transaction Analysis – EV/EBITDA ($ in millions, except per unit amounts) 2022E Adjusted EBITDA $1,717 Relevant EBITDA Multiple 7.25x—9.25x Implied Enterprise Value Based on 2022E Adjusted EBITDA $12,446—$15,879 Less: Preferred Equity1 (271) Less: Net Debt1 (5,364) Less: Noncontrolling Interests1 (25) Implied Equity Value $6,785—$10,219 DCP Units Outstanding 210 Implied DCP Unit Price Range—2022E EBITDA $32.37—$48.74 1. As of December 31, 2022 73

Preliminary Draft – Confidential D Downside Case

Preliminary Draft – Confidential Supplemental Valuation Materials – Lower Commodity Prices D Discounted Cash Flow Analysis ($ in millions, except per unit amounts) Summary Results For the Years Ending December 31, Exit Perpetuity 2023E 2024E 2025E 2026E 2027E Multiple Growth Adjusted EBITDA $1,300 $1,136 $1,112 $1,090 $1,082 $1,082 $1,082 Less: Tax Depreciation and Amortization¹ (10,031) (154) (127) (118) (116) (125) EBIT ($8,730) $983 $984 $972 $967 $957 Less: Cash Taxes — (58) (58) (72) (72) (354) EBIAT ($8,730) $924 $926 $900 $895 $603 Plus: Tax Depreciation and Amortization 10,031 154 127 118 116 125 Less: Maintenance Capex (150) (150) (125) (125) (125) (125) Less: Growth Capex (125) (50) (50) (50) (50) —Unlevered Free Cash Flow $1,025 $878 $878 $843 $836 $603 EBITDA Multiple / Perpetuity Growth Rate 8.75x 1.0% Implied Terminal Value $9,469 $8,701 Present Value of Terminal Value @ 8.0% Discount Rate $6,444 $5,698 Plus: Present Value of Unlevered Free Cash Flow @ 8.0% Discount Rate 3,729 Implied Enterprise Value $10,173 $9,427 Less: Preferred Equity2 ($271) Less: Net Debt2 (5,364) Less: Noncontrolling Interests2 (25) Implied Equity Value $4,513 $3,767 DCP Units Outstanding3 210 Implied Value per Unit $21.53 $17.97 Sensitivity Analysis Terminal Exit Multiple Perpetuity Growth Rate 7.75x 8.25x 8.75x 9.25x 9.75x —% 0.5% 1.0% 1.5% 2.0% 7.0% $19.69 $21.53 $23.37 $25.21 $27.05 7.0% $19.49 $21.82 $24.54 $27.75 $31.61 7.5% 18.84 20.64 22.44 24.23 26.03 7.5% 16.74 18.72 21.00 23.66 26.81 WACC 8.0% 18.01 19.77 21.53 23.28 25.04 WACC 8.0% 14.33 16.03 17.97 20.20 22.81 8.5% 17.21 18.93 20.64 22.36 24.08 8.5% 12.21 13.67 15.34 17.23 19.42 9.0% 16.42 18.10 19.78 21.46 23.13 9.0% 10.32 11.60 13.03 14.66 16.52 74 1. 2023E tax DD&A assumes 80% bonus depreciation calculated as the midpoint of the enterprise value range plus 2023E capital expenditures 2. Per DCP Management as of December 31, 2022 3. Includes 117.8mm common units held by DCP Midstream, LLC and DCP Midstream GP, LP, and 1.3mm phantom and performance units

Preliminary Draft – Confidential Supplemental Valuation Materials – Lower Commodity Prices D Peer Group Trading Analysis – EV/EBITDA ($ in millions, except per unit amounts) 2023E Adjusted EBITDA $1,300 Relevant EBITDA Multiple 8.25x—9.25x Implied Enterprise Value Based on 2023E Adjusted EBITDA $10,729—$12,029 Less: Preferred Equity1 (271) Less: Net Debt1 (5,364) Less: Noncontrolling Interests1 (25) Implied Equity Value $5,069—$6,369 DCP Units Outstanding 210 Implied DCP Unit Price Range—2023E EBITDA $24.18—$30.38 2024E Adjusted EBITDA $1,136 Relevant EBITDA Multiple 8.0x—9.0x Implied Enterprise Value Based on 2024E Adjusted EBITDA $9,090—$10,226 Less: Preferred Equity1 (271) Less: Net Debt1 (5,364) Less: Noncontrolling Interests1 (25) Implied Equity Value $3,430—$4,566 DCP Units Outstanding 210 Implied DCP Unit Price Range—2024E EBITDA $16.36—$21.78 Implied DCP Unit Price Range—2023E and 2024E EBITDA $16.36—$30.38 1. As of December 31, 2022 75

Preliminary Draft – Confidential Supplemental Valuation Materials – Lower Commodity Prices D Peer Group Trading Analysis – Price/DCF per LP Unit ($ in millions, except per unit amounts) 2023E DCF / LP Unit $3.94 Relevant Multiple 7.0x—8.0x Implied DCP Unit Price Range—2023E Price / DCF $27.56—$31.49 2024E DCF / LP Unit $3.30 Relevant Multiple 6.0x—7.0x Implied DCP Unit Price Range—2024E Price / DCF $19.79—$23.09 Implied DCP Unit Price Range—2023E and 2024E Price / DCF $19.79—$31.49 76

Preliminary Draft – Confidential Supplemental Valuation Materials – Lower Commodity Prices D Precedent M&A Transaction Analysis – EV/EBITDA ($ in millions, except per unit amounts) 2022E Adjusted EBITDA $1,717 Relevant EBITDA Multiple 7.25x—9.25x Implied Enterprise Value Based on 2022E Adjusted EBITDA $12,446—$15,879 Less: Preferred Equity1 (271) Less: Net Debt1 (5,364) Less: Noncontrolling Interests1 (25) Implied Equity Value $6,785—$10,219 DCP Units Outstanding 210 Implied DCP Unit Price Range—2022E EBITDA $32.37—$48.74 1. As of December 31, 2022 77
Exhibit (c)(4)

Exhibit (c)(4) Preliminary Draft – Confidential Analysis at Various Prices For Reference Only Implied Premium to: EV / EBITDA1 Implied Premium to: August 17 10-Day 20-Day 30-Day November 11 DCP Price Price VWAP2 of VWAP2 of VWAP2 of Price Offer per Unit $34.75 $34.46 $33.88 $32.49 2022E 2023E $38.73 Initial Offer $34.75 —% 0.8% 2.6% 6.9% 7.4x 7.6x (10.3%) 35.00 0.7% 1.6% 3.3% 7.7% 7.4 7.6 (9.6%) 36.00 3.6% 4.5% 6.2% 10.8% 7.5 7.8 (7.0%) 37.00 6.5% 7.4% 9.2% 13.9% 7.7 7.9 (4.5%) 38.00 9.4% 10.3% 12.1% 16.9% 7.8 8.0 (1.9%) Current Offer 38.25 10.1% 11.0% 12.9% 17.7% 7.8 8.1 (1.2%) 39.00 12.2% 13.2% 15.1% 20.0% 7.9 8.1 0.7% 40.00 15.1% 16.1% 18.1% 23.1% 8.0 8.3 3.3% 41.00 18.0% 19.0% 21.0% 26.2% 8.1 8.4 5.9% 42.00 20.9% 21.9% 24.0% 29.3% 8.3 8.5 8.4% 43.00 23.7% 24.8% 26.9% 32.3% 8.4 8.6 11.0% 44.00 26.6% 27.7% 29.9% 35.4% 8.5 8.8 13.6% 45.00 29.5% 30.6% 32.8% 38.5% 8.6 8.9 16.2% 46.00 32.4% 33.5% 35.8% 41.6% 8.7 9.0 18.8% 47.00 35.3% 36.4% 38.7% 44.6% 8.9 9.1 21.4% 48.00 38.1% 39.3% 41.7% 47.7% 9.0 9.3 23.9% DCP 1st Counter 49.00 41.0% 42.2% 44.6% 50.8% 9.1 9.4 26.5% Source: DCP filings, FactSet; as of November 11, 2022 1. EBITDA based on the DCP Financial Projections; Enterprise Value assumes balance sheet items as of December 31, 2022 per management model 2. Based on August 17, 2022 unaffected price date
Exhibit (c)(5)

Exhibit (c)(5) Preliminary Draft – Confidential DCP Distributions Analysis ($ in millions) DCP Distributions 2006–2021 $700 Cumulative Distributions Breakdown $658 Limited Partners $3,798 General Partners $1,021 $618 $600 IDR buy-in Public LPs $2,379 % public LPs distributions of total LPs 63% $545 $211 $171 $500 $482 $483 $120 $420 $124 $124 $406 s $400 n butio $104 $325 Dis tri $300 $277 $62 $447 $447 $425 $200 $181 $406 $132 $37 $358 $359 $316 $325 $102 $24 $81 $16 $100 $65 $215 $13 $13 $11 $145 $30 $0 $109 $3 $86 $13 $54 $68 $27 $—2006 2007 2008 2009 2010 2011 2012 2013 2014 2015 2016 2017 2018 2019 2020 2021 LPs GPs Source: DCP filings
Exhibit (c)(6)

Exhibit (C)(6) Preliminary Draft – Confidential DCP Financial Performance Overview November 15, 2022

Preliminary Draft – Confidential DCP Financial Performance Overview November 15, 2022 Preliminary Draft – Confidential DCP Financial Performance Overview ($ in millions, except per unit amounts) DCP Historical Performance – Continued Improvement Adjusted EBITDA Total Debt / EBITDA $1,768 4.9x 4.9x 4.6x 4.5x $1,291 4.2x $1,200 $1,252 $1,092 $1,017 2.7x 2017A 2018A 2019A 2020A 2021A 2022E 2017A 2018A 2019A 2020A 2021A 2022E Coverage Ratio 3.8x 2.6x 2.7x 1.3x 1.0x 1.1x 2017A 2018A 2019A 2020A 2021A 2022E Source: Public Filings; FactSet; as of November 11, 2022 1

Preliminary Draft – Confidential DCP Financial Performance Overview ($ in millions, except per unit amounts) DCP Financial Projections – Project Speedmaster vs. Project Dynamo PRIOR—Project Speedmaster Management Projections1 2022E 2023E 2024E 2025E 2026E 2027E NGLs ($/Gal) $0.60 $0.60 $0.60 $0.60 $0.60 $0.60 WTI ($/Bbl) 57.00 57.00 57.00 57.00 57.00 57.00 Henry Hub ($/MMBtu) 2.80 2.80 2.80 2.80 2.80 2.80 EBITDA $1,441 $1,486 $1,527 $1,527 $1,527 $1,527 Growth Capital $250 $250 $250 $250 $250 $250 Unclear on why EBITDA is lower in Current projections CURRENT—Project Dynamo Management Projections 2022E 2023E 2024E 2025E 2026E 2027E NGLs ($/Gal) $1.04 $0.75 $0.66 $0.60 $0.60 $0.60 WTI ($/Bbl) 93.75 73.80 68.04 64.12 61.16 58.81 Henry Hub ($/MMBtu) 7.26 5.56 4.76 4.59 4.52 4.50 EBITDA $1,749 $1,698 $1,578 $1,498 $1,474 $1,453 Growth Capital $140 $125 $50 $50 $50 $50 EBITDA Difference $308 $212 $51 ($29) ($53) ($74) % Difference 21.4% 14.2% 3.3% (1.9%) (3.5%) (4.8%) Source: DCP Management 1. Project Speedmaster Management Projections run through 2024E and are held flat thereafter 2

Preliminary Draft – Confidential These materials have been prepared by Evercore Group L.L.C. (“Evercore”) for the Special Committee (the “Special Committee”) of the Board of Directors of DCP Midstream GP, LLC, the general partner of DCP Midstream, LP (“DCP” or the “Partnership”) to whom such materials are directly addressed and delivered and may not be used or relied upon for any purpose other than as specifically contemplated. These materials are based on information provided by or on behalf of the Partnership and/or other potential transaction participants, from public sources or otherwise reviewed by Evercore. Evercore assumes no responsibility for independent investigation or verification of such information and has relied on such information being complete and accurate in all material respects. To the extent such information includes estimates and forecasts of future financial performance prepared by or reviewed with the management of the Partnership and/or other potential transaction participants or obtained from public sources, Evercore has assumed that such estimates and forecasts have been reasonably prepared on bases reflecting the best currently available estimates and judgments of such management (or, with respect to estimates and forecasts obtained from public sources, represent reasonable estimates). No representation or warranty, express or implied, is made as to the accuracy or completeness of such information and nothing contained herein is, or shall be relied upon as, a representation, whether as to the past, the present or the future. These materials were designed for use by specific persons familiar with the business and affairs of the Partnership. These materials are not intended to provide the sole basis for evaluating, and should not be considered a recommendation with respect to, any transaction or other matter. These materials have been developed by and are proprietary to Evercore and were prepared exclusively for the benefit and internal use of the Special Committee. These materials were compiled on a confidential basis for use of the Special Committee in evaluating the potential transaction described herein and not with a view to public disclosure or filing thereof under state or federal securities laws, and may not be reproduced, disseminated, quoted or referred to, in whole or in part, without the prior written consent of Evercore. These materials do not constitute an offer or solicitation to sell or purchase any securities and are not a commitment by Evercore (or any affiliate) to provide or arrange any financing for any transaction or to purchase any security in connection therewith. Evercore assumes no obligation to update or otherwise revise these materials. These materials may not reflect information known to other professionals in other business areas of Evercore and its affiliates. Evercore and its affiliates do not provide legal, accounting or tax advice. Accordingly, any statements contained herein as to tax matters were neither written nor intended by Evercore or its affiliates to be used and cannot be used by any taxpayer for the purpose of avoiding tax penalties that may be imposed on such taxpayer. Each person should seek legal, accounting and tax advice based on his, her or its particular circumstances from independent advisors regarding the impact of the transactions or matters described herein.
Exhibit (c)(7)

Exhibit (c)(7) Prelimina ry Draft – Confidential Historical Multiples and Share Price Performance Relative Price Performance Since January 1, 20191 250% 200% 150% 99.8% 100% 97.0% 50% 59.3% 46.2% —% (0.2%) (50%) (100%) 1/1/19 8/24/19 4/15/20 12/6/20 7/29/21 3/21/22 11/11/22 DCP Peers WTI HHUB S&P 500 Change in Share Price and Valuation Multiples Share Price EV / NTM EBITDA² 12/31/18 12/31/19 12/31/20 12/31/21 11/11/22 Δ 12/18-12/19 Δ 12/18-12/20 Δ 12/18-12/21 Δ 12/18-11/22 12/31/18 12/31/19 12/31/20 12/31/21 11/11/22 Δ 12/18-12/19 Δ 12/18-12/20 Δ 12/18-12/21 Δ 12/18-11/22 DCP $26.49 $24.49 $18.52 $27.48 $38.73 (7.6%) (30.1%) 3.7% 46.2% 7.9x 8.5x 8.6x 8.1x 7.7x 6.9% 9.2% 2.0% (2.9%) Peers: AM $11.18 $7.59 $7.71 $9.68 $11.18 (32.1%) (31.0%) (13.4%) 0.0% 2.7x 6.9x 8.1x 8.8x 9.1x 159.2% 200.5% 228.0% 239.4% CEQP 27.91 30.82 18.98 27.59 28.96 10.4% (32.0%) (1.1%) 3.8% 9.5 9.3 8.9 6.8 7.8 (2.1%) (6.6%) (28.3%) (18.0%) DTM NA NA NA 47.98 60.06 NA NA NA NA NA NA NA 9.8 9.7 NA NA NA NA ENLC 9.49 6.13 3.71 6.89 12.02 (35.4%) (60.9%) (27.4%) 26.7% 8.2 8.7 8.6 8.6 9.0 6.1% 3.7% 4.4% 9.7% ETRN 20.02 13.36 8.04 10.34 8.32 (33.3%) (59.8%) (48.4%) (58.4%) 12.4 10.5 9.5 10.3 10.8 (15.2%) (23.1%) (16.9%) (12.7%) HESM 16.98 22.68 19.57 27.63 28.91 33.6% 15.3% 62.7% 70.3% 28.1 4.6 4.0 3.9 4.1 (83.6%) (85.8%) (86.1%) (85.5%) KNTK 77.30 28.60 23.73 30.66 34.94 (63.0%) (69.3%) (60.3%) (54.8%) 23.6 9.0 10.0 11.2 8.7 (61.9%) (57.6%) (52.5%) (63.1%) OKE 53.95 75.67 38.38 58.76 64.65 40.3% (28.9%) 8.9% 19.8% 12.1 13.7 10.1 11.0 11.0 13.9% (16.2%) (8.7%) (8.7%) SMLP 150.75 49.65 12.49 22.20 20.14 (67.1%) (91.7%) (85.3%) (86.6%) 7.1 6.5 6.7 7.0 5.3 (8.2%) (6.2%) (1.2%) (25.1%) TRGP 36.02 40.83 26.38 52.24 72.64 13.4% (26.8%) 45.0% 101.7% 10.3 12.6 10.4 9.7 9.1 22.8% 0.6% (5.5%) (12.0%) WES 27.73 19.69 13.82 22.27 28.38 (29.0%) (50.2%) (19.7%) 2.3% 7.8 8.7 7.3 7.9 8.3 11.4% (6.6%) 0.8% 6.0% Peer Median (30.6%) (41.1%) (16.6%) 3.1% 9.9x 8.9x 8.7x 8.8x 9.0x 2.0% (6.6%) (7.1%) (12.3%) Source: FactSet market data as of November 11, 2022 1. Peers relative price performance calculated as an average of Peers indexed price performance 2. EV / NTM EBITDAX based on FactSet Consensus trading multiples 1

Preliminary Draft – Confidential Historical Multiples and Share Price Performance Relative Price Performance Since January 3, 20221 175% 125% 75% 57.2% 37.3% 25% 17.1% 7.7% (16.8%) (25%) 1/3/22 2/24/22 4/17/22 6/8/22 7/30/22 9/20/22 11/11/22 DCP Peers WTI HHUB S&P 500 Change in Share Price and Valuation Multiples Share Price EV / NTM EBITDA² 8/17/22 Current Δ 8/17/22—Current 8/17/22 Current Δ 8/17/22—Current DCP $34.75 $38.73 11.5% 7.4x 7.7x 3.4% Peers: AM $10.32 $11.18 8.3% 9.0x 9.1x 1.0% CEQP 26.03 28.96 11.3% 6.5 7.8 19.6% DTM 57.27 60.06 4.9% 10.1 9.7 (3.7%) ENLC 9.84 12.02 22.2% 8.4 9.0 7.9% ETRN 9.53 8.32 (12.7%) 11.1 10.8 (2.3%) HESM 29.99 28.91 (3.6%) 4.0 4.1 0.9% KNTK 38.61 34.94 (9.5%) 9.3 8.7 (6.1%) OKE 62.96 64.65 2.7% 11.1 11.0 (0.4%) SMLP 15.97 20.14 26.1% 7.2 5.3 (26.6%) TRGP 67.44 72.64 7.7% 8.3 9.1 9.1% WES 27.44 28.38 3.4% 8.0 8.3 3.7% Peer Median $27.44 $28.91 4.9% 8.4x 9.0x 0.9% Source: FactSet market data as of November 11, 2022 1. First trading day of 2022 – peers relative price performance calculated as an average of Peers indexed price performance 2. EV / NTM EBITDAX based on FactSet Consensus trading multiples 2
Exhibit (c)(8)

Preliminary Draft – Confidential Analysis at Various Prices For Reference Only Implied Premium to: EV / EBITDA1 Implied Premium to: August 17 10-Day 20-Day 30-Day November 28 DCP Price Price VWAP2 of VWAP2 of VWAP2 of Price Offer per Unit $34.75 $34.46 $33.88 $32.49 2022E 2023E $38.65 Initial Offer $34.75 —% 0.8% 2.6% 6.9% 7.4x 7.6x (10.1%) 35.00 0.7% 1.6% 3.3% 7.7% 7.4 7.6 (9.4%) 36.00 3.6% 4.5% 6.2% 10.8% 7.5 7.8 (6.9%) 37.00 6.5% 7.4% 9.2% 13.9% 7.7 7.9 (4.3%) 38.00 9.4% 10.3% 12.1% 16.9% 7.8 8.0 (1.7%) 2nd Offer 38.25 10.1% 11.0% 12.9% 17.7% 7.8 8.1 (1.0%) 39.00 12.2% 13.2% 15.1% 20.0% 7.9 8.1 0.9% Current Offer 39.25 12.9% 13.9% 15.8% 20.8% 7.9 8.2 1.6% 40.00 15.1% 16.1% 18.1% 23.1% 8.0 8.3 3.5% 41.00 18.0% 19.0% 21.0% 26.2% 8.1 8.4 6.1% 42.00 20.9% 21.9% 24.0% 29.3% 8.3 8.5 8.7% 43.00 23.7% 24.8% 26.9% 32.3% 8.4 8.6 11.3% 44.00 26.6% 27.7% 29.9% 35.4% 8.5 8.8 13.8% 45.00 29.5% 30.6% 32.8% 38.5% 8.6 8.9 16.4% 46.00 32.4% 33.5% 35.8% 41.6% 8.7 9.0 19.0% 47.00 35.3% 36.4% 38.7% 44.6% 8.9 9.1 21.6% SC 2nd Counter 47.25 36.0% 37.1% 39.4% 45.4% 8.9 9.2 22.3% 48.00 38.1% 39.3% 41.7% 47.7% 9.0 9.3 24.2% SC 1st Counter 49.00 41.0% 42.2% 44.6% 50.8% 9.1 9.4 26.8% Source: DCP filings, FactSet; as of November 28, 2022 1. EBITDA based on the DCP Financial Projections; Enterprise Value assumes balance sheet items as of December 31, 2022 per management model 2. Based on August 17, 2022 unaffected price date 1

Preliminary Draft – Confidential Preliminary Valuation of the Common Units Preliminary Valuation Summary For Reference Only Discounted Peer Group Discounted Cash Flow Analysis Distributions Trading Analysis MLP Analyst Analysis Precedent M&A Premiums Price Transaction Analysis Paid Targets Market Price/DCF Exit Multiple Perpetuity Grow th CAPM EV/EBITDA Return per LP Unit $65.00 Implied $57.64 range based on 5% $54.92 $55.00 $53.83 annual distribution $50.33 growth $50.20 $48.90 $48.61 $48.61 $48.61 through $47.93 $47.79 $45.92 $46.63 2027E1 $44.37 $44.33 $45.00 $45.00 $43.88 $44.05 $45.55 $41.61 $38.33 $40.29 $34.93 $38.46 $38.44 $37.36 $39.96 $38.00 $35.00 $36.65 $32.22 $34.86 $34.59 $33.41 $33.27 $30.30 $33.27 $33.56 $29.52 $31.66 $32.13 $32.28 $32.28 $32.28 $25.55 $29.71 $24.65 $25.00 $27.11 Price as of 11/28/22: $38.65 $25.10 Proposed Consideration: $39.25 $19.29 $19.79 $15.00 $16.31 $14.77 $5.00 4.0%—5.0% 7.25%—8.25% WACC Terminal Yield 8.25x—9.25x 6.5x—7.5x 2023E EBITDA 2023E DCF/LP Unit Median 9.0%—11.0%—Merger Analyst 7.25x—9.25x 11.0% 13.0% Premium: Price 8.25x—9.25x 0.5%—1.5% 2022E EBITDA Equity Equity 15.0%—Targets Exit Multiple Perpetuity Grow th Rate 8.0x—9.0x 6.0x—7.0x Cost of Cost of 2024E EBITDA 2024E DCF/LP Unit 30.0% Capital Capital Sensitivity Case B – Sensitivity Case C – Sensitivity Case C –DCP Financial Projections NYMEX Strip Pricing Case Higher Commodity Prices Lower Commodity Prices 1. For reference only: sensitivity case using a 5% annual distribution growth rate which assumes lower than the commodity super cycle board assumption of 7.5% growth and management 0% growth scenarios 2

Appendix

Preliminary Draft – Confidential Historical Multiples and Share Price Performance Relative Price Performance Since January 3, 20221 175% 125% 79.5% 75% 25% 37.1% 5.3% 1.6% (25%) (17.4%) 1/3/22 2/26/22 4/22/22 6/16/22 8/10/22 10/4/22 11/28/22 DCP Peers WTI HHUB S&P 500 Change in Share Price and Valuation Multiples Share Price EV / NTM EBITDA² 8/17/22 Current Ä 8/17/22—Current 8/17/22 Current Ä 8/17/22—Current DCP $34.75 $38.65 11.2% 7.4x 7.8x 0.4x Peers: AM $10.32 $10.97 6.3% 9.0x 9.2x 0.2x CEQP 26.03 28.40 9.1% 6.5 8.3 1.8 DTM 57.27 58.66 2.4% 10.1 10.2 0.1 ENLC 9.84 12.38 25.8% 8.4 9.0 0.7 ETRN 9.53 7.86 (17.5%) 11.1 10.3 (0.8) HESM 29.99 29.57 (1.4%) 9.5 9.5 (0.1) KNTK 38.61 32.51 (15.8%) 9.3 9.0 (0.3) OKE 62.96 63.72 1.2% 11.1 10.6 (0.5) SMLP 15.97 20.23 26.7% 7.2 6.6 (0.6) TRGP 67.44 72.29 7.2% 8.3 9.0 0.7 WES 27.44 27.01 (1.6%) 8.0 7.9 (0.1) Peer Median $27.44 $28.40 2.4% 9.0x 9.0x (0.1x) Source: FactSet market data as of November 28, 2022 1. First trading day of 2022 – peers relative price performance calculated as an average of Peers indexed price performance 2. EV / NTM EBITDAX based on FactSet Consensus trading multiples 3

Preliminary Valuation of the Common Units Peer Group Trading Analysis ($ in millions, except per unit/share amounts) Price/DCF Price Equity Enterprise Enterprise Value/EBITDA / CAFD per Share Distribution Yield Dist. Net Debt / Parthership / Company 11/28/22 Value Value 2023E 2024E 2023E 2024E Current 2023E Growth 2023E EBITDA Gathering & Processing MLPs/Companies Antero Midstream Corporation $10.97 $5,308 $8,678 9.1x 8.6x 9.2x 8.1x 8.2% 8.2% NM 3.5x Crestwood Equity Partners LP 28.40 3,057 7,461 8.2 7.8 5.1 4.7 9.2% 9.2% 3.7% 3.7 DT Midstream, Inc. 58.66 5,747 9,149 10.1 9.5 9.9 9.3 4.4% 4.6% 6.9% 3.6 EnLink Midstream, LLC 12.38 5,997 12,192 9.0 8.8 6.0 5.8 3.6% 4.0% 10.0% 3.4 Equitrans Midstream Corporation 7.86 3,438 10,882 10.4 9.2 6.3 5.4 7.6% 7.6% 2.4% 6.0 Hess Midstream Partners LP 29.57 7,097 10,003 9.4 8.8 8.1 7.8 7.6% 7.9% 4.0% 2.7 Kinetik Holdings Inc. 32.51 4,465 7,904 8.8 7.8 6.1 5.3 9.2% 9.6% 4.2% 3.8 ONEOK, Inc. 63.72 28,592 41,445 10.6 10.3 11.7 11.0 5.9% 5.9% 4.0% 3.3 Summit Midstream Partners, LP 20.23 213 1,944 6.5 6.0 NM NM —% —% NM 5.1 Targa Resources Corp. 72.29 16,694 30,046 8.9 8.7 7.0 6.8 1.9% 2.2% 10.0% 3.3 Western Midstream Partners, LP 27.01 10,711 17,520 7.8 7.6 6.3 5.9 7.4% 7.4% 11.8% 3.0 Mean 9.0x 8.5x 7.6x 7.0x 5.9% 6.1% 6.3% 3.8x Median 9.0 8.7 6.6 6.3 7.4% 7.4% 4.2% 3.5 DCP Midstream, LP (Consensus)1 $38.65 $8,078 $13,594 7.8x 8.2x 6.3x 6.7x 4.5% 4.7% 3.1% 2.7x DCP Midstream, LP (DCP Financial Projections)1 $38.65 $8,078 $13,594 8.0x 8.6x 6.5x 7.0x 4.5% 4.4% —% 3.0x Source: Company filings, FactSet, Wall Street Research; as of November 28, 2022 1. Balance sheet data as of September 30, 2022 4

Preliminary Draft – Confidential Weighted Average Cost of Capital Analysis DCP Common Units – Capital Asset Pricing Model ($ in millions, except per unit/share amounts) Unit/Share Price Market Equity Total Debt and Total Debt / Adjusted Unlevered 11/28/22 Value Preferred Equity Capitalization Beta 1 2 Partnership/Corporation Total Beta Antero Midstream Corporation $10.97 $5,308 $3,370 38.8% 0.77 0.51 Crestwood Equity Partners LP 28.40 3,057 4,182 57.8% 0.60 0.31 EnLink Midstream, LLC 12.38 5,997 4,579 43.3% 1.01 0.63 Equitrans Midstream Corporation 7.86 3,438 7,014 67.1% 0.89 0.34 Hess Midstream Partners LP 29.57 7,097 2,909 29.1% 0.73 0.57 Kinetik Holdings Inc. 32.51 4,465 3,448 43.6% 0.76 0.47 CAPM ONEOK, Inc. 63.72 28,592 12,876 31.1% 1.03 0.76 Summit Midstream Partners, LP 20.23 213 1,728 89.0% 0.91 0.13 Targa Resources Corp. 72.29 16,694 11,198 40.1% 0.90 0.59 Western Midstream Partners, LP 27.01 10,711 7,095 39.8% 0.88 0.60 Mean 48.0% 0.85 0.49 Median 41.7% 0.89 0.54 DCP Midstream, LP $38.65 $8,078 $5,584 40.9% 0.74 0.50 Risk-free Rate 3 4.0% Unlevered Beta 0.50 Debt and Preferred / Total Capitalization 40.9% Adjusted Levered Equity Beta 0.74 DCP Midstream Cost of Debt7 Supply-Side MRP Historical MRP WACC Market Risk Premium (“MRP”) 4 6.2% 7.5% Yield-to-Worst Small Company Risk Premium 5 0.7% DCP Midstream 5.600% Senior Notes Due 2044 6.08% Equity Cost of Capital 6 9.3% 10.2% U.S. Treasury Note Due 2042 3.97% Pre-Tax Cost of Debt 7 6.0% Less: U.S. Treasury Note Due 2044 4.08% After-Tax Cost of Debt 8 4.2% (0.11%) WACC 7.2% 7.7% DCP Midstream Implied 20-Year Cost of Debt 5.97% Equity Cost of Capital Sensitivity WACC Sensitivity (Supply-Side / Historical) (Supply-Side / Historical) Debt and Preferred / Total Capitalization Debt and Preferred / Total Capitalization 45.0% 50.0% 55.0% 60.0% 65.0% 45.0% 50.0% 55.0% 60.0% 65.0% 0.45 6.9% / 7.4% 6.8% / 7.3% 6.8% / 7.2% 6.7% / 7.2% 6.6% / 7.1% 0.45 9.1% / 10.0% 9.4% / 10.4% 9.9% / 10.9% 10.4% / 11.6% 11.1% / 12.4% ta 0.50 7.2% / 7.7% 7.1% / 7.6% 7.0% / 7.5% 7.0% / 7.5% 6.9% / 7.4% ta 0.50 9.6% / 10.6% 10.0% / 11.0% 10.5% / 11.6% 11.1% / 12.3% 11.9% / 13.3% evered e B 0.55 7.4% / 8.0% 7.4% / 7.9% 7.3% / 7.9% 7.2% / 7.8% 7.1% / 7.7% evered e B 0.55 10.1% / 11.1% 10.5% / 11.7% 11.0% / 12.3% 11.7% / 13.1% 12.6% / 14.1% nl 0.60 7.7% / 8.3% 7.6% / 8.3% 7.5% / 8.2% 7.5% / 8.1% 7.4% / 8.0% nl 0.60 10.6% / 11.7% 11.0% / 12.3% 11.6% / 13.0% 12.4% / 13.9% 13.3% / 15.0% U 0.65 8.0% / 8.7% 7.9% / 8.6% 7.8% / 8.5% 7.7% / 8.4% 7.6% / 8.3% U 0.65 11.1% / 12.3% 11.6% / 12.9% 12.2% / 13.7% 13.0% / 14.6% 14.0% / 15.9% 1. Source: Predicted raw betas from FactSet; Adjusted Equity Beta calculated as: (0.67) × Raw Beta +(0.33) × 1.0 2. Unlevered Beta calculated as: Adjusted Equity Beta × (E/(E + D × (1-T)); Assumes corporate tax rate of 29.6% for partnerships and 21.0% for corporations 3. 20-year Treasury as of November 28, 2022 4. Source: Duff & Phelps 5. Decile: Mid Cap (5) with equity value range of $6,743.4 million to $13,177.8 million 6. Equity Cost of Capital calculated as: Risk-free rate + (Levered Equity Beta × Market Risk Premium) + Small Company Risk Premium 7. Implied DCP 20-year cost of debt based on the yield-to-worst of DCP’s 5.600% Senior Notes Due 2044 adjusted for 20-year maturity using the implied yield spread from relevant U.S. treasury notes 8. Assumes U.S. individual partnership income tax structure through 2025 of 80.0% of income taxable at highest tax rate of 37.0%, or 29.6% 5

Preliminary Draft – Confidential Weighted Average Cost of Capital Analysis DCP Common Units – Total Expected Market Return ($ in millions, except per unit/share amounts) Unit/Share Price Market Equity Distribution/Dividend Total Partnership/Corporation 11/28/22 Value Current Yield Growth Return Antero Midstream Corporation $10.97 $5,308 8.2% —% 8.2% Crestwood Equity Partners LP 28.40 3,057 9.2% 3.7% 12.9% EnLink Midstream, LLC 12.38 5,997 3.6% 10.0% 13.7% Equitrans Midstream Corporation 7.86 3,438 7.6% 2.4% 10.0% Total Hess Midstream Partners LP 29.57 7,097 7.6% 4.0% 11.6% Expected Kinetik Holdings Inc. 32.51 4,465 9.2% 4.2% 13.5% Market ONEOK, Inc. 63.72 28,592 5.9% 4.0% 9.9% Return Targa Resources Corp. 72.29 16,694 1.9% 10.0% 11.9% Western Midstream Partners, LP 27.01 10,711 7.4% 11.8% 19.2% Mean 12.3% Median 11.9% DCP Midstream, LP $38.65 $8,078 4.5% 3.1% 7.6% WACC Debt and Preferred / Total Capitalization 40.9% Market Required Equity Return 11.9% WACC Pre-Tax Cost of Debt1 6.0% After-Tax Cost of Debt2 4.2% DCP Cost of Debt1 WACC 8.8% Yield-to-Worst DCP Midstream 5.600% Senior Notes Due 2044 6.08% U.S. Treasury Note Due 2042 3.97% Less: U.S. Treasury Note Due 2044 4.08% (0.11%) DCP Midstream Implied 20-Year Cost of Debt 5.97% 1. Implied DCP 20-year cost of debt based on the yield-to-worst of DCP’s 5.600% Senior Notes Due 2044 Adjusted for 20-year maturity using the implied yield spread from relevant U.S. treasury notes 2. Assumes U.S. individual partnership income tax structure through 2025 of 80.0% of income taxable at highest tax rate of 37.0%, or 29.6% 6
Exhibit (c)(9)

Preliminary Draft – Confidential Analysis at Various Prices For Reference Only Implied Premium to: EV / EBITDA1 Implied Premium to: August 17 10-Day 20-Day 30-Day December 6 DCP Price Price VWAP2 of VWAP2 of VWAP2 of Price Offer per Unit $34.75 $34.46 $33.88 $32.49 2022E 2023E $38.73 Initial Offer $34.75 —% 0.8% 2.6% 6.9% 7.4x 7.6x (10.3%) 35.00 0.7% 1.6% 3.3% 7.7% 7.4 7.6 (9.6%) 36.00 3.6% 4.5% 6.2% 10.8% 7.5 7.8 (7.0%) 37.00 6.5% 7.4% 9.2% 13.9% 7.7 7.9 (4.5%) 38.00 9.4% 10.3% 12.1% 16.9% 7.8 8.0 (1.9%) 2nd Offer 38.25 10.1% 11.0% 12.9% 17.7% 7.8 8.1 (1.2%) 39.00 12.2% 13.2% 15.1% 20.0% 7.9 8.1 0.7% 3rd Offer 39.25 12.9% 13.9% 15.8% 20.8% 7.9 8.2 1.3% Current Offer 39.75 14.4% 15.4% 17.3% 22.3% 8.0 8.2 2.6% 40.00 15.1% 16.1% 18.1% 23.1% 8.0 8.3 3.3% 41.00 18.0% 19.0% 21.0% 26.2% 8.1 8.4 5.9% 42.00 20.9% 21.9% 24.0% 29.3% 8.3 8.5 8.4% 43.00 23.7% 24.8% 26.9% 32.3% 8.4 8.6 11.0% 44.00 26.6% 27.7% 29.9% 35.4% 8.5 8.8 13.6% 45.00 29.5% 30.6% 32.8% 38.5% 8.6 8.9 16.2% 46.00 32.4% 33.5% 35.8% 41.6% 8.7 9.0 18.8% SC 3rd Counter 46.25 33.1% 34.2% 36.5% 42.3% 8.8 9.0 19.4% 47.00 35.3% 36.4% 38.7% 44.6% 8.9 9.1 21.4% SC 2nd Counter 47.25 36.0% 37.1% 39.4% 45.4% 8.9 9.2 22.0% 48.00 38.1% 39.3% 41.7% 47.7% 9.0 9.3 23.9% SC 1st Counter 49.00 41.0% 42.2% 44.6% 50.8% 9.1 9.4 26.5% Source: DCP filings, FactSet; as of December 6, 2022 1. EBITDA based on the DCP Financial Projections; Enterprise Value assumes balance sheet items as of December 31, 2022 per management model 2. Based on August 17, 2022 unaffected price date
Exhibit (c)(10)

Exhibit (c)(10) Preliminary Draft – Confidential Historical Multiples Change in Valuation Multiples Over Time EV / NTM EBITDA Multiples1 14.0x 1.2x Average Differential from Peers Since 1/1/2018 0.8x Average Differential from Peers YTD 12.0x 10.0x 8.9x 8.0x 7.8x 6.0x 4.0x 2.0x --x 1/1/18 12/27/18 12/22/19 12/16/20 12/11/21 12/6/22 DCP Peer Median 2 Source: FactSet market data as of December 6, 2022 1. EV / NTM EBITDA based on FactSet Consensus trading multiples 2. Peers include AM, CEQP, DTM, ENLC, ETRN, HESM, KNTK, OKE, SMLP, TRGP and WES
Exhibit (c)(11)

Preliminary Draft – Confidential Historical Multiples and Share Price Performance Relative Price Performance Since January 3, 20221 175% 125% 86.4% 75% 37.4% 25% 0.8% 0.2% (25%) (19.7%) 1/3/22 3/1/22 4/28/22 6/25/22 8/22/22 10/19/22 12/16/22 DCP Peers WTI HHUB S&P 500 Change in Share Price and Valuation Multiples Share Price EV / NTM EBITDA² 8/17/22 Current Ä 8/17/22—Current 8/17/22 Current Ä 8/17/22—Current DCP $34.75 $38.74 11.5% 7.4x 7.8x 0.4x Peers: AM $10.32 $10.57 2.4% 9.0x 8.7x (0.3x) CEQP 26.03 27.53 5.8% 6.5 7.7 1.2 DTM 57.27 55.35 (3.4%) 10.1 9.1 (1.0) ENLC 9.84 11.56 17.5% 8.4 8.7 0.3 ETRN 9.53 6.72 (29.5%) 11.1 10.2 (0.9) HESM 29.99 28.54 (4.8%) 9.7 9.2 (0.5) KNTK 38.61 32.39 (16.1%) 9.3 8.5 (0.8) OKE 62.96 64.49 2.4% 11.1 10.9 (0.2) SMLP 15.97 17.53 9.8% 7.2 6.4 (0.8) TRGP 67.44 70.10 3.9% 8.3 8.7 0.4 WES 27.44 26.26 (4.3%) 8.0 7.9 (0.1) Peer Median 2.4% 9.0x 8.7x (0.3x) Source: FactSet market data as of December 16, 2022 1. First trading day of 2022 – peers relative price performance calculated as an average of Peers indexed price performance 2. EV / NTM EBITDA based on FactSet Consensus trading multiples 1

Preliminary Draft – Confidential Historical Commodity Prices Historical Pricing of NGLs vs. Crude Oil since announcement Commodity Prices Since August 17, 2022 $1.20 $120.00 $1.00 $100.00 $0.80 $80.00 (16.2%) (35.9%) Bl) $ /Gal) (31.0%) /B ( $0.60 $60.00 ( $ NGLs WTI $0.40 $40.00 (38.0%) $0.20 $20.00 $—$ -8/17/22 9/6/22 9/26/22 10/16/22 11/5/22 11/25/22 12/16/22 Ethane Propane NGL Composite Historical WTI WTI is down by 16.2% and NGL Composite is down by 31.0% since announcement Source: FactSet data as of December 16, 2022 2

Preliminary Draft – Confidential Analysis at Various Prices For Reference Only Implied Premium to: EV / EBITDA1 Implied Premium to: August 17 10-Day 20-Day 30-Day December 16 DCP Price Price VWAP2 of VWAP2 of VWAP2 of Price Offer per Unit $34.75 $34.46 $33.88 $32.49 2022E 2023E $38.74 Initial Offer $34.75 —% 0.8% 2.6% 7.0% 7.4x 7.6x (10.3%) 35.00 0.7% 1.6% 3.3% 7.7% 7.4 7.6 (9.7%) 36.00 3.6% 4.5% 6.3% 10.8% 7.5 7.8 (7.1%) 37.00 6.5% 7.4% 9.2% 13.9% 7.7 7.9 (4.5%) 38.00 9.4% 10.3% 12.2% 17.0% 7.8 8.0 (1.9%) 2nd Offer 38.25 10.1% 11.0% 12.9% 17.7% 7.8 8.1 (1.3%) 39.00 12.2% 13.2% 15.1% 20.0% 7.9 8.1 0.7% 3rd Offer 39.25 12.9% 13.9% 15.9% 20.8% 7.9 8.2 1.3% 4th Offer 39.75 14.4% 15.4% 17.3% 22.3% 8.0 8.2 2.6% 40.00 15.1% 16.1% 18.1% 23.1% 8.0 8.3 3.3% Current Offer 40.50 16.5% 17.5% 19.5% 24.7% 8.1 8.3 4.5% 41.00 18.0% 19.0% 21.0% 26.2% 8.1 8.4 5.8% 42.00 20.9% 21.9% 24.0% 29.3% 8.3 8.5 8.4% 43.00 23.7% 24.8% 26.9% 32.3% 8.4 8.6 11.0% 44.00 26.6% 27.7% 29.9% 35.4% 8.5 8.8 13.6% SC 4th Counter 44.75 28.8% 29.9% 32.1% 37.7% 8.6 8.9 15.5% 45.00 29.5% 30.6% 32.8% 38.5% 8.6 8.9 16.2% 46.00 32.4% 33.5% 35.8% 41.6% 8.7 9.0 18.7% SC 3rd Counter 46.25 33.1% 34.2% 36.5% 42.4% 8.8 9.0 19.4% 47.00 35.3% 36.4% 38.7% 44.7% 8.9 9.1 21.3% SC 2nd Counter 47.25 36.0% 37.1% 39.5% 45.4% 8.9 9.2 22.0% 48.00 38.1% 39.3% 41.7% 47.7% 9.0 9.3 23.9% SC 1st Counter 49.00 41.0% 42.2% 44.6% 50.8% 9.1 9.4 26.5% Source: DCP filings, FactSet; as of December 16, 2022 1. EBITDA based on the DCP Financial Projections; Enterprise Value assumes balance sheet items as of December 31, 2022 per management model 2. Based on August 17, 2022 unaffected price date 3
Exhibit (c)(12)

Exhibit (c)(12) Preliminary Draft – Confidential Analysis at Various Prices For Reference Only Implied Premium to: EV / EBITDA1 Implied Premium to: August 17 10-Day 20-Day 30-Day December 16 DCP Price Price VWAP2 of VWAP2 of VWAP2 of Price Offer per Unit $34.75 $34.46 $33.88 $32.49 2022E 2023E $38.74 Initial Offer $34.75 —% 0.8% 2.6% 7.0% 7.4x 7.6x (10.3%) 35.00 0.7% 1.6% 3.3% 7.7% 7.4 7.6 (9.7%) 36.00 3.6% 4.5% 6.3% 10.8% 7.5 7.8 (7.1%) 37.00 6.5% 7.4% 9.2% 13.9% 7.7 7.9 (4.5%) 38.00 9.4% 10.3% 12.2% 17.0% 7.8 8.0 (1.9%) 2nd Offer 38.25 10.1% 11.0% 12.9% 17.7% 7.8 8.1 (1.3%) 39.00 12.2% 13.2% 15.1% 20.0% 7.9 8.1 0.7% 3rd Offer 39.25 12.9% 13.9% 15.9% 20.8% 7.9 8.2 1.3% 4th Offer 39.75 14.4% 15.4% 17.3% 22.3% 8.0 8.2 2.6% 40.00 15.1% 16.1% 18.1% 23.1% 8.0 8.3 3.3% 5th Offer 40.50 16.5% 17.5% 19.5% 24.7% 8.1 8.3 4.5% Current Offer 41.00 18.0% 19.0% 21.0% 26.2% 8.1 8.4 5.8% 42.00 20.9% 21.9% 24.0% 29.3% 8.3 8.5 8.4% 43.00 23.7% 24.8% 26.9% 32.3% 8.4 8.6 11.0% SC 5th Counter 43.25 24.5% 25.5% 27.7% 33.1% 8.4 8.7 11.6% 44.00 26.6% 27.7% 29.9% 35.4% 8.5 8.8 13.6% SC 4th Counter 44.75 28.8% 29.9% 32.1% 37.7% 8.6 8.9 15.5% 45.00 29.5% 30.6% 32.8% 38.5% 8.6 8.9 16.2% 46.00 32.4% 33.5% 35.8% 41.6% 8.7 9.0 18.7% SC 3rd Counter 46.25 33.1% 34.2% 36.5% 42.4% 8.8 9.0 19.4% 47.00 35.3% 36.4% 38.7% 44.7% 8.9 9.1 21.3% SC 2nd Counter 47.25 36.0% 37.1% 39.5% 45.4% 8.9 9.2 22.0% 48.00 38.1% 39.3% 41.7% 47.7% 9.0 9.3 23.9% SC 1st Counter 49.00 41.0% 42.2% 44.6% 50.8% 9.1 9.4 26.5% 1 Source: DCP filings, FactSet; as of December 16, 2022 1. EBITDA based on the DCP Financial Projections; Enterprise Value assumes balance sheet items as of December 31, 2022 per management model 2. Based on August 17, 2022 unaffected price date

Preliminary Draft – Confidential Preliminary Valuation of the Common Units Preliminary Valuation Summary For Reference Only Discounted Peer Group Discounted Cash Flow Analysis Distributions Trading Analysis MLP Analyst Analysis Precedent M&A Premiums Price Transaction Analysis Paid Targets Market Price/DCF Exit Multiple Perpetuity Grow th CAPM EV/EBITDA Return per LP Unit $65.00 $61.07 Implied range based on 5% $55.00 annual $53.18 $52.70 $51.96 distribution $50.33 $49.58 growth $50.20 $48.61 $48.61 $48.61 through $45.33 2027E1 $45.91 $45.77 $44.37 $44.33 $45.00 $45.00 $43.31 $44.05 $44.86 $41.61 $38.33 $42.24 $37.84 $38.44 $37.36 $39.96 $38.00 $35.00 $34.93 $36.05 $35.15 $32.22 $34.86 $34.59 $33.35 $33.27 $33.27 $29.52 $33.56 $32.13 $28.75 $32.28 $32.28 $32.28 $27.68 $29.71 $24.22 $25.00 $27.11 Price as of 12/16/22: $38.74 $25.10 Proposed Consideration: $41.00 $19.79 $18.84 $15.00 $16.31 $15.98 $5.00 4.0%—5.0% 7.0%—8.0% WACC Terminal Yield 8.0x—9.0x 6.5x—7.5x Merger 2023E EBITDA 2023E DCF/LP Unit Premium 9.0%—11.0%—Analyst 7.25x—9.25x Selected 11.0% 13.0% Price 8.0x—9.0x 0.5%—1.5% 2022E EBITDA Range: Equity Equity Targets Exit Multiple Perpetuity Grow th Rate 8.0x—9.0x 6.0x—7.0x 15.0%—Cost of Cost of 2024E EBITDA 2024E DCF/LP Unit 30.0% Capital Capital Sensitivity Case B – Sensitivity Case C – Sensitivity Case C –DCP Financial Projections NYMEX Strip Pricing Case Higher Commodity Prices Lower Commodity Prices 1. For reference only: sensitivity case using a 5% annual distribution growth rate which assumes lower than the commodity super cycle board assumption of 7.5% growth and management 0% growth scenarios 2

Preliminary Draft – Confidential Appendix

Preliminary Draft – Confidential Historical Multiples and Share Price Performance Relative Price Performance Since January 3, 20221 175% 125% 86.4% 75% 37.4% 25% 0.8% 0.2% (25%) (19.7%) 1/3/22 3/1/22 4/28/22 6/25/22 8/22/22 10/19/22 12/16/22 DCP Peers WTI HHUB S&P 500 Change in Share Price and Valuation Multiples Share Price EV / NTM EBITDA² 8/17/22 Current Δ 8/17/22—Current 8/17/22 Current Δ 8/17/22—Current DCP $34.75 $38.74 11.5% 7.4x 7.8x 0.3x Peers: AM $10.32 $10.57 2.4% 9.0x 9.0x (0.0x) CEQP 26.03 27.53 5.8% 6.5 8.2 1.6 DTM 57.27 55.35 (3.4%) 10.1 9.8 (0.3) ENLC 9.84 11.56 17.5% 8.4 8.7 0.3 ETRN 9.53 6.72 (29.5%) 11.1 9.8 (1.3) HESM 29.99 28.54 (4.8%) 9.7 9.2 (0.5) KNTK 38.61 32.39 (16.1%) 9.3 8.9 (0.4) OKE 62.96 64.49 2.4% 11.1 10.6 (0.4) SMLP 15.97 17.53 9.8% 7.2 6.4 (0.8) TRGP 67.44 70.10 3.9% 8.3 8.8 0.5 WES 27.44 26.26 (4.3%) 8.0 7.8 (0.2) Peer Median 2.4% 9.0x 8.9x (0.3x) Source: FactSet market data as of December 16, 2022 1. First trading day of 2022 – peers relative price performance calculated as an average of Peers indexed price performance 2. EV / NTM EBITDA based on FactSet Consensus trading multiples 3

Preliminary Draft – Confidential Preliminary Valuation of the Common Units Peer Group Trading Analysis ($ in millions, except per unit/share amounts) Price/DCF Price Equity Enterprise Enterprise Value/EBITDA / CAFD per Share Distribution Yield Dist. Net Debt / Parthership / Company 12/16/22 Value Value 2023E 2024E 2023E 2024E Current 2023E Growth 2023E EBITDA Gathering & Processing MLPs/Companies Antero Midstream Corporation $10.57 $5,114 $8,484 8.9x 8.5x 8.8x 7.9x 8.5% 8.5% NM 3.5x Crestwood Equity Partners LP 27.53 2,964 7,368 8.1 7.7 4.9 4.6 9.5% 9.5% 3.7% 3.7 DT Midstream, Inc. 55.35 5,423 8,825 9.7 9.2 9.1 8.6 4.6% 4.9% 6.9% 3.6 EnLink Midstream, LLC 11.56 5,600 11,795 8.7 8.5 5.5 5.3 3.9% 4.3% 10.0% 3.4 Equitrans Midstream Corporation 6.72 2,940 10,384 9.8 9.1 5.3 4.9 8.9% 8.9% 0.8% 6.0 Hess Midstream Partners LP 28.54 6,849 9,756 9.4 8.9 7.9 7.5 7.9% 8.3% 4.0% 2.8 Kinetik Holdings Inc. 32.39 4,449 7,888 8.8 7.9 6.1 5.4 9.3% 9.7% 4.3% 3.8 ONEOK, Inc. 64.49 28,937 41,791 10.5 10.2 11.8 11.2 5.8% 5.8% 4.0% 3.2 Summit Midstream Partners, LP 17.53 184 1,916 6.4 6.2 NM NM —% —% NM 5.1 Targa Resources Corp. 70.10 16,188 29,540 8.8 8.5 6.8 6.5 2.0% 2.4% 10.0% 3.3 Western Midstream Partners, LP 26.26 10,414 17,222 7.8 7.5 6.9 6.3 7.6% 7.6% 10.9% 3.0 Mean 8.8x 8.4x 7.3x 6.8x 6.2% 6.4% 6.1% 3.8x Median 8.8 8.5 6.8 6.4 7.6% 7.6% 4.3% 3.5 DCP Midstream, LP (Consensus)1 $38.74 $8,097 $13,613 7.8x 8.2x 6.3x 6.7x 4.4% 4.7% 3.1% 2.7x DCP Midstream, LP (DCP Financial Projections)1 $38.74 $8,097 $13,613 8.0x 8.6x 6.5x 7.0x 4.4% 4.4% —% 3.0x Source: Company filings, FactSet, Wall Street Research; as of December 16, 2022 1. Balance sheet data as of September 30, 2022 4

Preliminary Draft – Confidential Weighted Average Cost of Capital Analysis DCP Common Units – Capital Asset Pricing Model ($ in millions, except per unit/share amounts) Unit/Share Price Market Equity Total Debt and Total Debt / Adjusted Unlevered 12/16/22 Value Preferred Equity Capitalization Beta 1 2 Partnership/Corporation Total Beta Antero Midstream Corporation $10.57 $5,114 $3,370 39.7% 0.79 0.52 Crestwood Equity Partners LP 27.53 2,964 4,182 58.5% 0.62 0.31 EnLink Midstream, LLC 11.56 5,600 4,579 45.0% 0.98 0.60 Equitrans Midstream Corporation 6.72 2,940 7,014 70.5% 0.94 0.33 Hess Midstream Partners LP 28.54 6,849 2,909 29.8% 0.75 0.58 Kinetik Holdings Inc. 32.39 4,449 3,448 43.7% 0.73 0.45 CAPM ONEOK, Inc. 64.49 28,937 12,876 30.8% 1.04 0.77 Summit Midstream Partners, LP 17.53 184 1,728 90.4% 0.90 0.12 Targa Resources Corp. 70.10 16,188 11,198 40.9% 0.92 0.60 Western Midstream Partners, LP 26.26 10,414 7,095 40.5% 0.89 0.60 Mean 49.0% 0.86 0.49 Median 42.3% 0.90 0.55 DCP Midstream, LP $38.74 $8,097 $5,584 40.8% 0.72 0.49 Risk-free Rate 3 3.7% Unlevered Beta 0.49 Debt and Preferred / Total Capitalization 40.8% Adjusted Levered Equity Beta 0.72 DCP Midstream Cost of Debt7 Supply-Side MRP Historical MRP WACC Market Risk Premium (“MRP”) 4 6.2% 7.5% Yield-to-Worst Small Company Risk Premium 5 0.7% DCP Midstream 5.600% Senior Notes Due 2044 5.81% Equity Cost of Capital 6 8.9% 9.8% U.S. Treasury Note Due 2042 3.73% Pre-Tax Cost of Debt 7 5.5% Less: U.S. Treasury Note Due 2044 4.08% After-Tax Cost of Debt 8 3.8% (0.35%) WACC 6.9% 7.4% DCP Midstream Implied 20-Year Cost of Debt 5.47% Equity Cost of Capital Sensitivity WACC Sensitivity (Supply-Side / Historical) (Supply-Side / Historical) Debt and Preferred / Total Capitalization Debt and Preferred / Total Capitalization 45.0% 50.0% 55.0% 60.0% 65.0% 45.0% 50.0% 55.0% 60.0% 65.0% ed 0.45 6.6% / 7.1% 6.5% / 7.0% 6.5% / 6.9% 6.4% / 6.8% 6.3% / 6.8%ed 0.45 8.9% / 9.7% 9.2% / 10.2% 9.6% / 10.7% 10.2% / 11.3% 10.9% / 12.2% r 0.50 6.9% / 7.4% 6.8% / 7.3% 6.7% / 7.2% 6.6% / 7.2% 6.6% / 7.1% r 0.50 9.3% / 10.3% 9.7% / 10.8% 10.2% / 11.4% 10.8% / 12.1% 11.6% / 13.0% Beta 0.55 7.1% / 7.7% 7.1% / 7.6% 7.0% / 7.5% 6.9% / 7.5% 6.8% / 7.4% Beta 0.55 9.8% / 10.9% 10.3% / 11.4% 10.8% / 12.1% 11.5% / 12.9% 12.3% / 13.9% nleve U 0.60 7.4% / 8.1% 7.3% / 8.0% 7.2% / 7.9% 7.2% / 7.8% 7.1% / 7.7% nleve U 0.60 10.3% / 11.5% 10.8% / 12.1% 11.4% / 12.8% 12.1% / 13.6% 13.1% / 14.8% 0.65 7.7% / 8.4% 7.6% / 8.3% 7.5% / 8.2% 7.4% / 8.1% 7.3% / 8.0% 0.65 10.8% / 12.1% 11.3% / 12.7% 12.0% / 13.5% 12.8% / 14.4% 13.8% / 15.6% 1. Source: Predicted raw betas from FactSet; Adjusted Equity Beta calculated as: (0.67) × Raw Beta +(0.33) × 1.0 2. Unlevered Beta calculated as: Adjusted Equity Beta × (E/(E + D × (1-T)); Assumes corporate tax rate of 29.6% for partnerships and 21.0% for corporations 3. 20-year Treasury as of December 16, 2022 4. Source: Duff & Phelps 5. Decile: Mid Cap (5) with equity value range of $6,743.4 million to $13,177.8 million 6. Equity Cost of Capital calculated as: Risk-free rate + (Levered Equity Beta × Market Risk Premium) + Small Company Risk Premium 7. Implied DCP 20-year cost of debt based on the yield-to-worst of DCP’s 5.600% Senior Notes Due 2044 adjusted for 20-year maturity using the implied yield spread from relevant U.S. treasury notes 8. Assumes U.S. individual partnership income tax structure through 2025 of 80.0% of income taxable at highest tax rate of 37.0%, or 29.6% 5
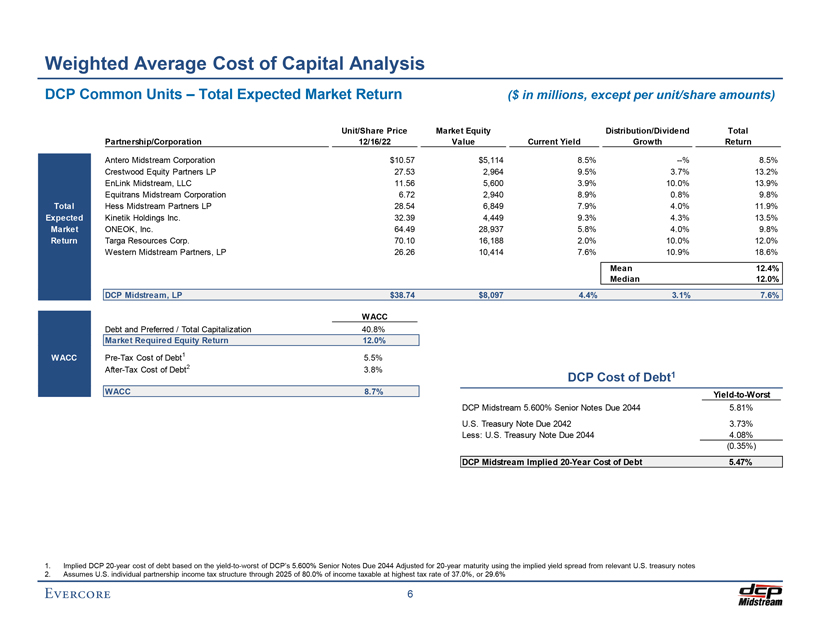
Preliminary Draft – Confidential Weighted Average Cost of Capital Analysis DCP Common Units – Total Expected Market Return ($ in millions, except per unit/share amounts) Unit/Share Price Market Equity Distribution/Dividend Total Partnership/Corporation 12/16/22 Value Current Yield Growth Return Antero Midstream Corporation $10.57 $5,114 8.5% —% 8.5% Crestwood Equity Partners LP 27.53 2,964 9.5% 3.7% 13.2% EnLink Midstream, LLC 11.56 5,600 3.9% 10.0% 13.9% Equitrans Midstream Corporation 6.72 2,940 8.9% 0.8% 9.8% Total Hess Midstream Partners LP 28.54 6,849 7.9% 4.0% 11.9% Expected Kinetik Holdings Inc. 32.39 4,449 9.3% 4.3% 13.5% Market ONEOK, Inc. 64.49 28,937 5.8% 4.0% 9.8% Return Targa Resources Corp. 70.10 16,188 2.0% 10.0% 12.0% Western Midstream Partners, LP 26.26 10,414 7.6% 10.9% 18.6% Mean 12.4% Median 12.0% DCP Midstream, LP $38.74 $8,097 4.4% 3.1% 7.6% WACC Debt and Preferred / Total Capitalization 40.8% Market Required Equity Return 12.0% WACC Pre-Tax Cost of Debt1 5.5% After-Tax Cost of Debt2 3.8% DCP Cost of Debt1 WACC 8.7% Yield-to-Worst DCP Midstream 5.600% Senior Notes Due 2044 5.81% U.S. Treasury Note Due 2042 3.73% Less: U.S. Treasury Note Due 2044 4.08% (0.35%) DCP Midstream Implied 20-Year Cost of Debt 5.47% 1. Implied DCP 20-year cost of debt based on the yield-to-worst of DCP’s 5.600% Senior Notes Due 2044 Adjusted for 20-year maturity using the implied yield spread from relevant U.S. treasury notes 2. Assumes U.S. individual partnership income tax structure through 2025 of 80.0% of income taxable at highest tax rate of 37.0%, or 29.6% 6
Exhibit (c)(13)

Exhibit (c)(13) Preliminary Draft – Confidential Discussion Materials Prepared for the Special Committee of the Board of Directors of DCP Midstream GP, LLC January 5, 2023

Preliminary Draft – Confidential These materials have been prepared by Evercore Group L.L.C. (“Evercore”) for the Special Committee (the “Special Committee”) of the Board of Directors of DCP Midstream GP, LLC, the general partner of the general partner of DCP Midstream, LP (“DCP” or the “Partnership”), to whom such materials are directly addressed and delivered and may not be used or relied upon for any purpose other than as specifically contemplated. These materials are based on information provided by or on behalf of the Partnership and/or other potential transaction participants, from public sources or otherwise reviewed by Evercore. Evercore assumes no responsibility for independent investigation or verification of such information and has relied on such information being complete and accurate in all material respects. To the extent such information includes estimates and forecasts of future financial performance prepared by or reviewed with the management of the Partnership and/or other potential transaction participants or obtained from public sources, Evercore has assumed that such estimates and forecasts have been reasonably prepared on bases reflecting the best currently available estimates and judgments of such management (or, with respect to estimates and forecasts obtained from public sources, represent reasonable estimates). No representation or warranty, express or implied, is made as to the accuracy or completeness of such information and nothing contained herein is, or shall be relied upon as, a representation, whether as to the past, the present or the future. These materials were designed for use by specific persons familiar with the business and affairs of the Partnership. These materials are not intended to provide the sole basis for evaluating, and should not be considered a recommendation with respect to, any transaction or other matter. These materials have been developed by and are proprietary to Evercore and were prepared exclusively for the benefit and internal use of the Special Committee. These materials were compiled on a confidential basis for use of the Special Committee in evaluating the potential transaction described herein and not with a view to public disclosure or filing thereof under state or federal securities laws, and may not be reproduced, disseminated, quoted or referred to, in whole or in part, without the prior written consent of Evercore. These materials do not constitute an offer or solicitation to sell or purchase any securities and are not a commitment by Evercore (or any affiliate) to provide or arrange any financing for any transaction or to purchase any security in connection therewith. Evercore assumes no obligation to update or otherwise revise these materials. These materials may not reflect information known to other professionals in other business areas of Evercore and its affiliates. Evercore and its affiliates do not provide legal, accounting or tax advice. Accordingly, any statements contained herein as to tax matters were neither written nor intended by Evercore or its affiliates to be used and cannot be used by any taxpayer for the purpose of avoiding tax penalties that may be imposed on such taxpayer. Each person should seek legal, accounting and tax advice based on his, her or its particular circumstances from independent advisors regarding the impact of the transactions or matters described herein.

Preliminary Draft – Confidential Table of Contents Section Executive Summary I DCP Situation Analysis II DCP Financial Projections III Preliminary Valuation of the Common Units IV Appendix A. Weighted Average Cost of Capital Analysis B. Supplemental Valuation Materials C. LPG Market Overview

Preliminary Draft – Confidential I. Executive Summary

Preliminary Draft – Confidential Executive Summary Introduction and Overview of Materials â—¼ï€ Evercore Group L.L.C. (“Evercore”) is pleased to provide the following materials to the Special Committee (the “Special Committee”) of the Board of Directors of DCP Midstream GP, LLC (“DCP GP LLC”), the general partner of DCP Midstream GP, LP (the “General Partner”), which is the general partner of DCP Midstream, LP (“DCP” or the “Partnership”), regarding the proposed acquisition by Phillips 66 and its affiliates (collectively, “PSX,” “Phillips 66” or the “Parent”) of all of the outstanding common units (the “Common Units”) of the Partnership not already owned by Phillips 66, Enbridge, Inc. (“ENB”) and their affiliates (the “Public Common Units” and the holders of such Public Common Units, the “Partnership Unaffiliated Unitholders”) for cash (the “Merger”) ï,„ï€ Pursuant to an agreement and plan of merger by and among the Partnership, DCP GP LLC, the General Partner, the Parent, Phillips 66 Project Development Inc., a wholly-owned subsidiary of the Parent (“PDI”), and Dynamo Merger Sub LLC, a wholly-owned subsidiary of PDI (“Merger Sub”) (the “Merger Agreement”), Merger Sub shall merge with and into the Partnership and each Common Unit owned by a Partnership Unaffiliated Unitholder shall be converted into the right to receive $41.75 in cash (the “Merger Consideration”) • Implies a 20.1% premium to PSX’s offer of $34.75 per Public Common Unit (the “Original Offer”) made as of August 17, 2022 (the “Unaffected Date”) • Represents a 21.2% premium to the 10-day1 VWAP of the Common Units as of the Unaffected Date • Represents a 28.5% premium to the 30-day1 VWAP of the Common Units as of the Unaffected Date • PSX currently owns 43.3% of the Common Units2 A â—¼ï€ The Evercore analysis reviews valuation of the Common Units based on the financial projections for DCP as provided by DCP management (the “DCP Financial Projections” or the “Forecast”) as well as sensitivities based on certain price decks including:ï,„ï€ B A sensitivity case utilizing NYMEX Strip Pricing as of January 3, 2023 (“Sensitivity Case B – NYMEX Strip Pricing Case”)ï,„ï€ A sensitivity case based on assumed pricing higher than that utilized in the DCP Financial Projections (“Sensitivity Case C – C Higher Commodity Prices”) ï,„ï€ A sensitivity case based on assumed pricing lower than that utilized in the DCP Financial Projections (“Sensitivity Case D – D Lower Commodity Prices”) Source: DCP Management, FactSet 1. Trading days 2. As of January 4, 2023 1

Preliminary Draft – Confidential Executive Summary Overview of the Transaction Counterparty â—¼ï€ Phillips 66 (NYSE: PSX) â—¼ï€ PSX to acquire 100% of the Public Common Units owned by the Partnership Unaffiliated Unitholders Transaction â—¼ï€ DCP’s Common Units will cease to be publicly traded Summary â–º DCP’s preferred units will continue to be publicly traded Merger â—¼ï€ $41.75 in cash per Public Common Unit Consideration â—¼ï€ Approval of the Special Committee and the Board of Directors of DCP Midstream GP, LLC, the Approvals general partner of the general partner of DCP â—¼ï€ The Merger is a taxable transaction for the Partnership Unaffiliated Unitholders resulting in the Other realization of taxes on deferred income and capital gains 2

Preliminary Draft – Confidential Executive Summary Evercore Evaluation Process Evercore has been asked by the Special Committee, whether, in Evercore’s opinion, as of the date hereof, Opinion and based upon and subject to the assumptions, qualifications, limitations and other matters set forth Requested: therein, the Merger Consideration to be received in the Merger is fair, from a financial point of view, to the Partnership and the Partnership Unaffiliated Unitholders â—¼ï€ In connection with rendering an opinion, Evercore has, among other things: ï,„ï€ reviewed certain publicly available historical operating and financial information relating to the Partnership that we deemed relevant, including as set forth in the Partnership’s Annual Report on Form 10-K for the year ended December 31, 2021, the Partnership’s Quarterly Report on Form 10-Q for the quarter ended September 30, 2022, and certain of the Partnership’s Current Reports on Form 8-K, in each case as filed with or furnished to the Securities and Exchange Commission;ï,„ï€ reviewed certain publicly available business and financial information relating to the Partnership that we deemed to be relevant, including publicly available research analysts’ estimates; ï,„ï€ reviewed certain internal projected financial data relating to the Partnership prepared and furnished to us by management of the Partnership, as approved for our use by the Partnership (the “Forecast”); ï,„ï€ reviewed certain published information regarding commodity prices; ï,„ï€ discussed with management of the Partnership its assessment of the past and current operations of the Partnership, the current financial condition and prospects of the Partnership, and the Forecast;ï,„ï€ reviewed the reported prices and the historical trading activity of the Common Units;ï,„ï€ performed discounted cash flow analyses for the Partnership based on the Forecast and other data provided by management of the Partnership;ï,„ï€ performed discounted distributions analyses based on projected financial data and other data provided by management of the Partnership;ï,„ï€ compared the financial performance of the Partnership and its stock market trading multiples with those of certain other publicly-traded companies and partnerships that we deemed relevant;ï,„ï€ compared the financial performance of the Partnership and the valuation multiples relating to the Merger with the financial terms, to the extent publicly available, of certain other historical transactions that we deemed relevant; ï,„ï€ reviewed the financial terms and conditions of a draft Merger Agreement dated January 4, 2023; andï,„ï€ performed such other analyses and examinations and considered such other factors that we deemed appropriate. 3
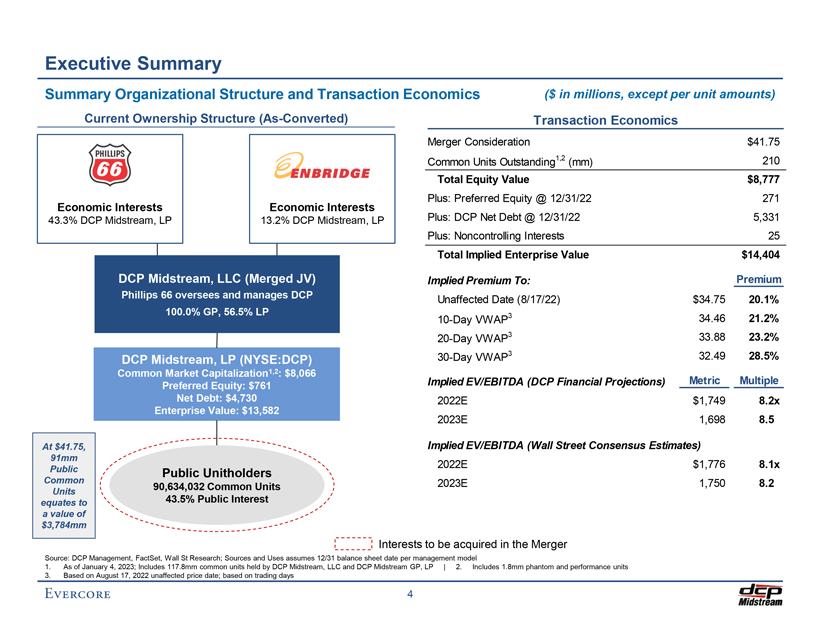
Preliminary Draft – Confidential Executive Summary Summary Organizational Structure and Transaction Economics ($ in millions, except per unit amounts) Current Ownership Structure (As-Converted) Transaction Economics Merger Consideration $41.75 Common Units Outstanding1,2 (mm) 210 Total Equity Value $8,777 Plus: Preferred Equity @ 12/31/22 271 Economic Interests Economic Interests Plus: DCP Net Debt @ 12/31/22 5,331 43.3% DCP Midstream, LP 13.2% DCP Midstream, LP Plus: Noncontrolling Interests 25 Total Implied Enterprise Value $14,404 DCP Midstream, LLC (Merged JV) Implied Premium To: Premium Phillips 66 oversees and manages DCP Unaffected Date (8/17/22) $34.75 20.1% 100.0% GP, 56.5% LP 3 10-Day VWAP 34.46 21.2% 20-Day VWAP3 33.88 23.2% 30-Day VWAP3 32.49 28.5% DCP Midstream, LP (NYSE:DCP) Common Market Capitalization1,2: $8,066 Implied EV/EBITDA (DCP Financial Projections) Metric Multiple Preferred Equity: $761 Net Debt: $4,730 2022E $1,749 8.2x Enterprise Value: $13,582 2023E 1,698 8.5 At $41.75, Implied EV/EBITDA (Wall Street Consensus Estimates) 91mm 2022E $1,776 8.1x Public Public Unitholders Common 2023E 1,750 8.2 90,634,032 Common Units Units equates to 43.5% Public Interest a value of $3,784mm Interests to be acquired in the Merger Source: DCP Management, FactSet, Wall St Research; Sources and Uses assumes 12/31 balance sheet date per management model 1. As of January 4, 2023; Includes 117.8mm common units held by DCP Midstream, LLC and DCP Midstream GP, LP | 2. Includes 1.8mm phantom and performance units 3. Based on August 17, 2022 unaffected price date; based on trading days 4

Preliminary Draft – Confidential Executive Summary DCP Common Unit Trading Analysis Premium of Merger Consideration DCP Price Relative to Historical Average Merger Consideration $41.75 Unaffected Date (8/17/22) $34.75 20.1% 10-Day VWAP Prior to Unaffected Date 34.46 21.2% 20-Day VWAP Prior to Unaffected Date 33.88 23.2% 30-Day VWAP Prior to Unaffected Date 32.49 28.5% 60-Day VWAP Prior to Unaffected Date 32.47 28.6% 6-Month VWAP Prior to Unaffected Date 33.00 26.5% 12-Month VWAP Prior to Unaffected Date 30.84 35.4% $45.00 Merger Consideration: $41.75 $40.00 $38.59 Original Offer: $34.75 $35.00 $30.00 $25.00 Offer Date: 8/17/22 $20.00 $15.00 1/1/21 5/27/21 10/21/21 3/16/22 8/10/22 1/4/23 Historical Price (DCP) Original Offer 10-Day VWAP Prior to Unaffected Date 20-Day VWAP Prior to Unaffected Date 30-Day VWAP Prior to Unaffected Date 60-Day VWAP Prior to Unaffected Date 6-Month VWAP Prior to Unaffected Date 12-Month VWAP Prior to Unaffected Date Merger Consideration Source: FactSet; as of January 4, 2023 Note: VWAP based on August 17, 2022 unaffected price date; based on trading days 5

Preliminary Draft – Confidential Executive Summary Side-by-Side Analysis ($ in millions, except per unit / share amounts) DCP Total Units Outstanding1 209 Common Unit Price $38.59 Total Equity Value $8,066 Plus: Preferred Equity 761 Plus: Net Debt 4,730 Plus: Noncontrolling Interest 25 Enterprise Value $13,582 DCP Financial Projections Consensus Data Metric Yield/Multiple Metric Yield/Multiple EV/EBITDA 2022E $1,749 7.8x $1,776 7.6x 2023E 1,698 8.0 1,750 7.8 2024E 1,578 8.6 1,665 8.2 P / DCF per LP Unit 2022E $6.12 6.3x $6.26 6.2x 2023E 5.92 6.5 6.15 6.3 2024E 5.55 7.0 5.81 6.6 Distribution Yield Current $1.72 4.5% $1.72 4.5% 2023E 1.72 4.5% 1.81 4.7% 2024E 1.72 4.5% 1.91 4.9% Distribution Coverage 2022E $6.12 3.7x $6.26 3.7x 2023E 5.92 3.4 6.15 3.4 2024E 5.55 3.2 5.81 3.0 PSX Fully-Diluted Shares Outstanding 476 Common Share Price $100.68 Total Equity Value $47,936 Plus: Net Debt 13,913 Plus: Noncontrolling Interest 5,076 Enterprise Value $66,925 Consensus Data Metric Yield/Multiple EV/EBITDA 2022E $15,612 4.3x 2023E 11,075 6.0 2024E 9,536 7.0 P / FCFPS 2022E $15.45 6.5x 2023E 12.85 7.8 2024E 10.74 9.4 Dividend Yield Current $3.88 3.9% 2023E 3.98 3.9% 2024E 4.15 4.1% Note: As of January 4, 2023; Balance sheet data per Partnership / Company filings as of September 30, 2022 Source: FactSet, company filings, DCP Management 1. Includes 117.8mm common units held by DCP Midstream, LLC and DCP Midstream GP, LP, and 0.6mm phantom and performance units 6
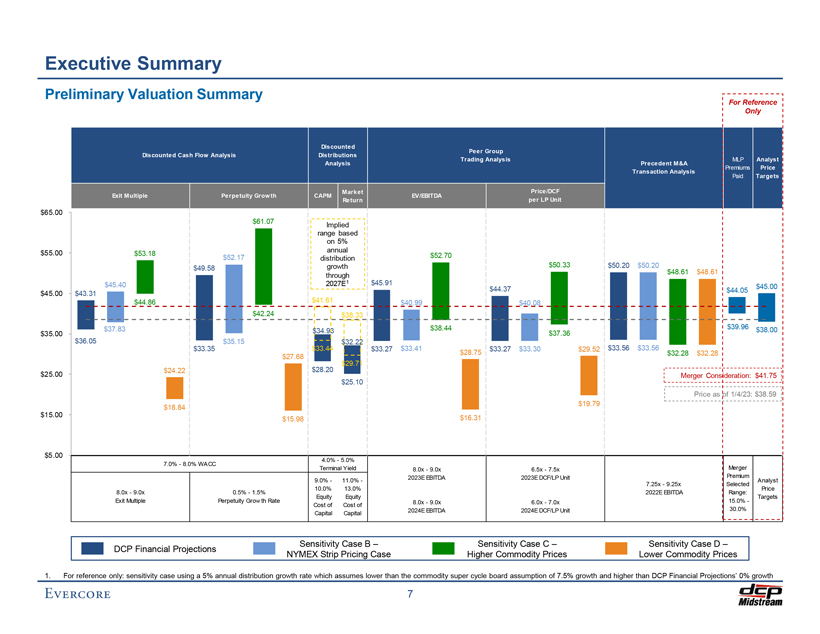
Preliminary Draft – Confidential Executive Summary Preliminary Valuation Summary For Reference Only Discounted Peer Group Discounted Cash Flow Analysis Distributions Trading Analysis MLP Analyst Analysis Precedent M&A Premiums Price Transaction Analysis Paid Targets Market Price/DCF Exit Multiple Perpetuity Grow th CAPM EV/EBITDA Return per LP Unit $65.00 $61.07 Implied range based on 5% $55.00 annual $53.18 $52.70 $52.17 distribution growth $50.33 $50.20 $50.20 $49.58 $48.61 $48.61 through $45.40 2027E1 $45.91 $44.37 $45.00 $45.00 $43.31 $44.05 $44.86 $41.61 $40.99 $40.08 $42.24 $38.33 $37.83 $38.44 $39.96 $38.00 $35.00 $34.93 $37.36 $36.05 $35.15 $32.22 $33.35 $33.44 $33.27 $33.41 $33.27 $33.30 $29.52 $33.56 $33.56 $28.75 $32.28 $32.28 $27.68 $28.20 $29.71 $24.22 $25.00 Merger Consideration: $41.75 $25.10 Price as of 1/4/23: $38.59 $19.79 $18.84 $15.00 $16.31 $15.98 $5.00 4.0%—5.0% 7.0%—8.0% WACC Terminal Yield 8.0x—9.0x 6.5x—7.5x Merger 2023E EBITDA 2023E DCF/LP Unit Premium 9.0%—11.0%—Analyst 7.25x—9.25x Selected 10.0% 13.0% Price 8.0x—9.0x 0.5%—1.5% 2022E EBITDA Range: Equity Equity Targets Exit Multiple Perpetuity Grow th Rate 8.0x—9.0x 6.0x—7.0x 15.0%—Cost of Cost of 2024E EBITDA 2024E DCF/LP Unit 30.0% Capital Capital Sensitivity Case B – Sensitivity Case C – Sensitivity Case D –DCP Financial Projections NYMEX Strip Pricing Case Higher Commodity Prices Lower Commodity Prices 1. For reference only: sensitivity case using a 5% annual distribution growth rate which assumes lower than the commodity super cycle board assumption of 7.5% growth and higher than DCP Financial Projections’ 0% growth 7

Preliminary Draft – Confidential Executive Summary Benefits to the Partnership of the Merger â—¼ï€ Simplified structure â—¼ï€ Reduced cost of capital under the Parent’s capital structure and improved access to capital â—¼ï€ Reduced pro forma leverage given ability to repay debt on an accelerated basis â—¼ï€ Participation in pro forma cost savings and operating synergies including enhanced connectivity from wellhead to end markets â—¼ï€ Greater flexibility and ability to pursue growth projects and strategic acquisitions â—¼ï€ Reduced reporting requirements as a wholly-owned subsidiary of PSX 8

Preliminary Draft – Confidential Executive Summary Benefits to the Partnership of the Merger â—¼ï€ Simplified structure â—¼ï€ Reduced cost of capital under the Parent’s capital structure and improved access to capital â—¼ï€ Reduced pro forma leverage given ability to repay debt on an accelerated basis â—¼ï€ Participation in pro forma cost savings and operating synergies including enhanced connectivity from wellhead to end markets â—¼ï€ Greater flexibility and ability to pursue growth projects and strategic acquisitions â—¼ï€ Reduced reporting requirements as a wholly-owned subsidiary of PSX 8

Preliminary Draft – Confidential DCP Situation Analysis Partnership Overview Description Asset Map â—¼ï€ DCP is a Delaware limited partnership formed to own and operate a diversified portfolio of midstream energy assets â—¼ï€ Two reportable segments: Logistics and Marketing; Gathering and Processing ï,„ï€ Logistics and Marketing includes fractionating NGLs as well as transporting, trading, marketing and storing natural gas and NGLs ï,„ï€ Gathering and Processing includes gathering, compressing, treating, and processing natural gas, as well as producing and fractionating NGLs and recovering condensate â—¼ï€ Credit rating: Ba1 (Moody’s); BBB+ (S&P) Volumes By Segment (Q3’22) NGL Pipeline Volume and Utilization Q3’22 Avg. Q3’22 Pipeline (MBbls/d) Throughput Utilization Sand Hills 313 94% Southern Hills 117 91% Front Range 79 91% Texas Express 23 62% Other 199 64% Total 731 81% G&P Volume and Utilization Q3’22 Avg. Q3’22 Plant (MMcf/d) Wellhead Vol. Utilization North 1,600 101% Midcontinent 840 76% Permian 1,047 86% South 1,005 62% Total 4,492 81% 9 Source: Public filings

Preliminary Draft – Confidential DCP Situation Analysis Logistics and Marketing Overview Logistics & Marketing segment is fee-based or fee-like and includes NGL and gas takeaway pipelines, marketing, trading, storage and fractionators % Ownership / DCP Logistics Assets Segment Description Operated â—¼ï€ Sand Hills provides NGL takeaway / Cheyenne Connector from the Permian and Eagle Ford to 67% ï¡ â—¼ï€ Operated by Tallgrass the Gulf Coast â—¼ï€ DCP 50% Owner â—¼ï€ Southern Hills provides NGL 67% / ï¡ï€ takeaway from the DJ Basin and the NGL Midcontinent to Gulf Coast markets Takeaway â—¼ï€ Front Range / Texas Express provide NGL takeaway from the DJ 33% / 10% / Basinï² â–º Both operated by Enterprise Southern Hills Products Partners L.P. (“EPD”) Front Range â—¼ï€ DCP 67% owner â—¼ï€ Operated by EPD â—¼ï€ Gulf Coast Express provides ~2.0 25% / ï² â—¼ï€ DCP 33% owner Bcf/d gas takeaway from the Texas Express Permian to the Gulf Coast â—¼ï€ Operated by EPD Gulf Coast Express â—¼ï€ DCP 10% Owner â–º Operated by Kinder Morgan, â—¼ï€ Operated by KMI Inc. (“KMI”) â—¼ï€ DCP 25% owner â—¼ï€ Guadalupe provides 245 MMcf/d Gas 50% / ï²ï€ gas takeaway from the Permian Takeaway â—¼ï€ Cheyenne Connector provides 600 Mont Belvieu 50% / ï² MMcf/d gas takeaway from the DJ â—¼ï€ DCP 12.5% owner Basin to the Rockies Express in the Enterprise fractionator Pipeline â—¼ï€ DCP 20% owner in â–º Operated by Tallgrass Energy Mont Belvieu 1 Partners, LP (“Tallgrass”) fractionator â—¼ï€ 12 Bcf Spindletop natural gas 100% / ï¡ï€ storage facility in SE Texas Legend: Gas & NGL â—¼ï€ 8 MMBbls Marysville NGL storage Storage 100% / ï¡ DCP operated facility in Michigan Third party operated â—¼ï€ Equity ownership of 56 MBpd of Guadalupe Market Hub 12.5% / 20% / Mont Belvieu fractionation â—¼ï€ Waha to New Braunfels 50%/50% DCP/EPD Sand Hillsï²ï€ NGL or Natural Fractionation capacity â—¼ï€ New Braunfels to Dewville 100% DCP â—¼ï€ DCP 67% owner Gas Pipeline â—¼ï€ Additional field fractionation â—¼ï€ Dewville to Katy 50%/50% DCP/ETC Katy â—¼ï€ Katy Header 100% DCP capacity of 70 MBpd 10

Preliminary Draft – Confidential DCP Situation Analysis Gathering and Processing Overview North Assets Permian Assets South Assets Midcontinent Assets / James Lake Asset type Fractionator & Plant Natural Gas Plant NGL Pipeline Natural Gas Pipeline DJ Basin Delaware Basin Eagle Ford SCOOP/STACK â—¼ï€ 10 active plants â—¼ï€ 4 active plants â—¼ï€ 4 active plants â—¼ï€ 5 active plants â—¼ï€ 1,160 MMcf/d capacity â—¼ï€ 640 MMcf/d capacity â—¼ï€ 690 MMcf/d capacity â—¼ï€ 560 MMcf/d capacity â—¼ï€ ~3,000 miles of gathering â—¼ï€ ~6,700 miles of gathering â—¼ï€ ~5,000 miles of gathering â—¼ï€ ~10,000 miles of gathering Michigan/Collbran Midland Basin/Other East Texas Liberal/Panhandle â—¼ï€ 3 active treaters â—¼ï€ 7 active plants â—¼ï€ 1 active plant â—¼ï€ 1 active plant â—¼ï€ 420 MMcf/d capacity â—¼ï€ 700 MMcf/d capacity â—¼ï€ 400 MMcf/d capacity â—¼ï€ 550 MMcf/d capacity â—¼ï€ ~500 miles of gathering â—¼ï€ ~8,700 miles of gathering â—¼ï€ ~1,000 miles of gathering â—¼ï€ ~13,500 miles of gathering Select Customers Select Customers Gulf Coast/Other Select Customers â—¼ï€ 2 active plants â—¼ï€ 540 MMcf/d capacity â—¼ï€ ~1000 miles of gathering Select Customers Note: Number of active processing plants and active plant capacity excludes idled plants and includes DCP’s proportionate ownership share of capacity. Delaware Basin includes recently acquired James Lake System 11

Preliminary Draft – Confidential DCP Situation Analysis DCP Organizational Structure Economic Interests Economic Interests 43.3% DCP Midstream, LP 13.2% DCP Midstream, LP 6.5% Gray Oak Pipeline, LLC 58.5% Gray Oak Pipeline, LLC DCP Midstream, LLC (Merged JV) Phillips 66 oversees and manages DCP GP and LP interests Enbridge oversees and manages GOP interest Public Other JV Unitholders Partners 43.5% LP 100.0% GP 56.5% LP 65.0% 35.0% Source: Public filings 12

Preliminary Draft – Confidential DCP Situation Analysis ($ in millions, except per unit amounts) Market Capitalization Balance Sheet and Credit Data As of January 4, 2023 As of September 30, 2022 Total Units Outstanding1 209 Cash and Marketable Securities $93 Common Unit Price $38.59 Short-Term Debt 506 Total Equity Value $8,066 Long-Term Debt 4,317 Plus: Preferred Equity 761 Total Debt $4,823 Plus: Net Debt 4,730 Net Debt $4,730 Plus: Noncontrolling Interest 25 Plus: Noncontrolling Interest 25 Enterprise Value $13,582 Plus: Preferred Equity 761 Plus: Partners’ Capital 5,600 DCP Financial Projections Consensus Data Net Book Capitalization $11,116 Metric Yield/Multiple Metric Yield/Multiple Distribution Yield Revolver Availability / Total Revolver Capacity $1,390 / $1,400 Current $1.72 4.5% $1.72 4.5% Net Debt / Net Book Cap 42.6% 2022E 1.64 4.2% 1.68 4.4% Net Debt / 2022E EBITDA 2.7x 2023E 1.72 4.5% 1.81 4.7% Net Debt / 2023E EBITDA 2.7 EV/EBITDA 2022E $1,749 7.8x $1,776 7.6x 2023E 1,698 8.0 1,750 7.8 2024E 1,578 8.6 1,665 8.2 Unit Price and Distribution $45.00 $2.50 tri Dis e Merger Consideration: $41.75 c bu r i $30.00 $2.00 ti P on Unit per $15.00 $1.50 Unit $— $1.00 1/4/21 5/5/21 9/4/21 1/4/22 5/5/22 9/4/22 1/4/23 Distribution per Unit Unit Price Source: DCP filings, FactSet as of January 4, 2023 1. Includes 117.8mm common units held by DCP Midstream, LLC and DCP Midstream GP, LP, and 0.6mm phantom and performance units 13

Preliminary Draft – Confidential DCP Situation Analysis DCP Wall Street Research ($ in millions, except per unit amounts) Summary Price Targets Analyst Recommendations Firm Analyst Date Recommendation Target Price Wells Fargo Michael Blum 12/15/22 Hold $39.00 Stifel Selman Akyol 12/12/22 Buy 45.00 Mizuho Gabriel Moreen 12/2/22 Buy 45.00 Raymond James J.R. Weston 11/4/22 Buy 45.00 Hold 40% RBC Elvira Scotto 11/3/22 Hold 38.00 Buy Median: $45.00 60% Mean: 42.40 High: 45.00 Low: 38.00 Distribution Per Unit Estimates EBITDA Estimates 3 02 12 . 9 5 2 91 . 2 81 5 81 82 84 . 2 80 8 . 2 2 . . 79 1 $ 78 81 2,0 5 2 . 72 7 . . 1 7 . 1 7 52 50 50 98 50 68 68 68 . 1 1 $ $ 6 . . 64 . 6 1 . 1 1 1 $ . 1 $ . 46 16 . 1 $ $ 1 1 1,8 1 1 1 . $ $ $ $ $ 1,7 1,7 1,7 1,7 1,7 1,796 1,741 1,768 1,7 6 , 98 1 1 $ $ $ $ $ $ 1,6 $ 1,673 $ $ $ $ $ $ $ $ $ $ 1,6 1,665 1 1,6 $ $ $ 1,578 $ $ $ $ 1,4 $ $ 2022E 2023E 2024E NA NA NA NA 2023E 2024E 2025E 2023E 2024E 2025E Wells Fargo Stifel Mizuho Raymond James RBC FactSet Consensus DCP Financial Projections Source: FactSet, public filings; as of January 4, 2023 Note: Analyst estimates do not reflect information provided by P66 on how P66 plans to manage DCP going forward if the Merger were not to proceed 14

Preliminary Draft – Confidential DCP Situation Analysis Analyst Price Targets and Comparison of Valuation Methodologies Price Target Date Broker Valuation Methodology Based on PSX’s original buyout offer of $34.75/unit plus an assumption that the company raises its offer $39.00 15-Dec-22 by ~12% based on past midstream simplification transactions $45.00 12-Dec-22 Derived by applying a 9.0x multiple to Stifel’s 2023 EBITDA estimate of $1.7 billion Blended valuation based on: (1) a 10-year, three-stage distribution/dividend discount model; (2) forward $45.00 4-Nov-22 free cash flow yield relative to comparable industry peers; and (3) forward enterprise value-to-EBITDA multiples relative to comparable industry peers $38 price target using PSX’s $34.75 offer price and adding a 10% premium, based on some previous $38.00 3-Nov-22 transactions in the space. The $38 price target represents an overall EV/EBITDA of ~6.9x and a target yield of 4.3% off of RBC’s one-year-out annualized distribution estimate Premium / 16.6% (Discount) 1.1% 16.6% (1.5%) to Current $45.00 Merger $45.00 Consideration: $41.75 $39.00 $38.00 Current Unit Price¹: $38.59 Source: Wall Street research, FactSet Note: Analyst estimates do not reflect information provided by P66 on how P66 plans to manage DCP going forward if the Merger were not to proceed 1. Unit price as of January 4, 2023 15

Preliminary Draft – Confidential DCP Situation Analysis Ratings Agency Commentary The credit profile is now closely tied to PSX and agencies anticipate continued debt reduction Current Ratings Senior Unsecured BBB+ Senior Unsecured Ba1 Outlook Stable Outlook Positive Analyst Mike Llanos Analyst James Wilkins Recent Comments S&P’s Credit Opinion: August 18, 2022 â—¼ï€ The stable outlook reflects expectation that Phillips 66 will fully integrate DCP’s assets into its midstream operations while the partnership maintains S&P Global Ratings-adjusted leverage of less than 4x over the intermediate term â—¼ï€ The partnership is 70% fee-based allowing it to capitalize on the above-average commodity price, however this level of direct commodity price exposure makes the partnership more susceptible to cash flow volatility What could prompt an UPGRADE: ï,„ï€ Would only raise rating on DCP if they raise rating on Phillips 66ï,„ï€ Could raise PSX rating if non-refining segments account for much larger share of future consolidated EBITDA, which would mitigate cash flow volatility of its refining assets What could prompt a DOWNGRADE: ï,„ï€ If Phillips 66’s adjusted debt to EBITDA consistently exceeds 3.0x Moody’s Credit Opinion: August 19, 2022 â—¼ï€ Expects credit metrics will continue to improve and be supportive of an investment grade rating as free cash flow continues to be applied towards debt reduction â—¼ï€ Credit challenges include exposure to regulatory risk for DJ Basin operations in the state of Colorado and uncertainty regarding longer term demand for hydrocarbons What could prompt an UPGRADE: ï,„ï€ EBITDA continues to grow ï,„ï€ Debt to EBITDA is maintained below 4.0x on a sustained basisï,„ï€ Distribution coverage remains above 1.3x What could prompt a DOWNGRADE: ï,„ï€ Debt to EBITDA exceeds 4.5x ï,„ï€ Distribution coverage falls below 1.0x Source: Standard & Poor’s Rating Services and Moody’s 16

Preliminary Draft – Confidential DCP Situation Analysis DCP Midstream, LP Common Unit Ownership Summary Top 20 Institutional Unit Holders Rank Investor Type Units (000’s) % of Total 1 ALPS Advisors, Inc. Investment Adviser 12,890 6.2% 2 Tortoise Capital Advisors LLC Investment Adviser 8,892 4.3% 3 Harvest Fund Advisors LLC Investment Adviser 8,075 3.9% 4 Goldman Sachs Asset Management LP Investment Adviser 5,711 2.7% 5 JPMorgan Securities LLC Investment Adviser 4,591 2.2% 6 Chickasaw Capital Management LLC Investment Adviser 3,136 1.5% 7 Citigroup Global Markets, Inc. (Investment Management) Investment Adviser 2,241 1.1% 8 ClearBridge Investments LLC Investment Adviser 2,108 1.0% 9 Global X Management Co. LLC Investment Adviser 2,094 1.0% 10 Barclays Bank Plc Private Banking/Wealth Mgmt 1,792 0.9% 11 Invesco Advisers, Inc. Investment Adviser 1,757 0.8% 12 RR Advisors LLC Hedge Fund Manager 1,379 0.7% 13 Bank of America, NA (Private Banking) Private Banking/Wealth Mgmt 1,281 0.6% 14 First Trust Advisors LP Investment Adviser 1,154 0.6% 15 CIBC Private Wealth Advisors, Inc. Investment Adviser 952 0.5% 16 Eagle Global Advisors LLC Private Banking/Wealth Mgmt 880 0.4% 17 Wells Fargo Bank, NA Private Banking/Wealth Mgmt 867 0.4% 18 Infrastructure Capital Advisors LLC Investment Adviser 855 0.4% 19 Antara Capital LP Hedge Fund Manager 790 0.4% 20 UBS Securities LLC Broker 769 0.4% Remainder 10,750 5.2% Total Institutional Ownership 72,963 35.0% Unit Ownership Breakdown Institutional PSX and ENB 35% Owned Common Units 56% Retail 7% Insiders 2% Unit Ownership Summary Holder Units (000’s) Ownership % Institutional 72,963 35.0% Insiders 3,808 1.8% Retail 13,863 6.7% Total Common Units Outstanding 90,634 43.5% Plus: PSX and ENB Owned Common Units 117,763 56.5% Total Units Outstanding1 208,397 100.0% Source: Wall Street research, FactSet; as of January 4, 2023 1. Excludes 0.6mm phantom and performance units 17

Preliminary Draft – Confidential III. DCP Financial Projections

Preliminary Draft – Confidential DCP Financial Projections DCP Financial Projections – Assumptions â—¼ï€ A The DCP Financial Projections as provided by DCP Management and reviewed by Evercore, incorporate the following assumptions:ï,„ï€ September 23, 2022 price deck as follows: Price Deck 2022E 2023E 2024E 2025E 2026E 2027E NGLs ($/Gal) $1.04 $0.75 $0.66 $0.60 $0.60 $0.60 WTI ($/Bbl) 93.75 73.80 68.04 64.12 61.16 58.81 Henry Hub ($/MMBtu) 7.26 5.56 4.76 4.59 4.52 4.50 ï,„ï€ Interest rates on debt as follows: NGL Composite Pricing • Revolving Credit Facility: Approximately 4.5%-5.5% annually $1.20 DCP Financial Projections • Permanent Debt Average: Approximately 5.5%-6.0% annually $1.00 $0.95 ï,„ï€ Preferred Equity redeemed once eligible and financed with debt 0 and cash flow from operations: 0 . $0.75 $0.80 1 3 $ $0.66 • $500 Series A redeemed in Q3 2022 8 $0.60 $0.60 $0.60 0 . $0.60 $ 71 8 • $161 Series B redeemed in Q2 2023 . 0 . 6 5 5 5 $ 0 . 6 6 . 6 $ . • $110 Series C redeemed in Q4 2023 $0.40 $ 0 0 $ 0 Common Units outstanding: $ ï,„ $0.20 • 90.6 million publicly held LP Units • 117.8 million DCP LP Units $— ï,„ï€ Quarterly distributions per LP held flat at $0.43/unit throughout 2021 A 2022A 2023 E 2024 E 2025E E 2026 E 2027 the projection period ï,„ï€ No minimum cash balance Historical NYMEX Strip Pricing (01/03/23) ï,„ï€ Maintenance capital expenditures of $134.7 million per year in 2022E, $150.0 million per year in 2023E and 2024E and $125.0 million per year from 2025E to 2027E ï,„ï€ Growth capital expenditures: • Identified organic capital expenditures of $114.4 million in 2H 2022 • Identified acquisition capital expenditures of $144.0 million in 2H 2022 • Unidentified organic capital expenditures of $125.0 million in 2023E and $50.0 million per year from 2024E to 2027E Source: DCP Management Note: DCP Financial Projections do not include effects of the Merger 18

Preliminary Draft – Confidential DCP Financial Projections DCP Financial Projections – Sensitivity Assumptions â—¼ï€ At the direction of the Special Committee, Evercore requested that DCP Management provide financial projections for DCP B assuming NYMEX Strip Pricing as of January 3, 2023 (“Sensitivity Case B – NYMEX Strip Pricing Case”): NYMEX Strip Pricing Case 2022E 2023E 2024E 2025E 2026E 2027E NGLs ($/Gal) $1.04 $0.71 $0.68 $0.66 $0.66 $0.66 WTI ($/Bbl) 93.75 76.58 72.42 68.61 65.57 62.98 Henry Hub ($/MMBtu) 7.26 3.90 4.14 4.31 4.41 4.45 â—¼ï€ Also at the direction of the Special Committee, the following two additional commodity price cases were requested to reflect higher and lower price environments, although these levels have not been realized historically over a long period of time: â—¼ï€ C A sensitivity case which assumes the following higher commodity pricing (“Sensitivity Case C – Higher Commodity Prices”): Higher Commodity Prices 2022E 2023E 2024E 2025E 2026E 2027E NGLs ($/Gal) $1.01 $0.90 $0.78 $0.77 $0.76 $0.75 WTI ($/Bbl) 95.10 87.50 76.50 75.50 74.50 73.50 Henry Hub ($/MMBtu) 6.50 5.85 5.15 5.10 5.05 5.00 â—¼ï€ D A sensitivity case which assumes the following lower commodity pricing (“Sensitivity Case D – Lower Commodity Prices”): Lower Commodity Prices 2022E 2023E 2024E 2025E 2026E 2027E NGLs ($/Gal) $1.01 $0.59 $0.42 $0.42 $0.42 $0.42 WTI ($/Bbl) 95.10 40.00 40.00 40.00 40.00 40.00 Henry Hub ($/MMBtu) 6.50 2.25 2.25 2.25 2.25 2.25 19

Preliminary Draft – Confidential DCP Financial Projections DCP Financial Projections – NGL Price Cases NGL Composite Barrel ($/Gal) $1.40 $1.20 $1.00 l ) /Ga $0.80 ( $ $0.75 Average: $0.70 NGLs $0.66 $0.60 $0.60 $0.42 $0.40 $0.20 $— Jan-18 Nov-18 Sep-19 Jul-20 May-21 Mar-22 Jan-23 Nov-23 Sep-24 Jul-25 May-26 Mar-27 Dec-27 Historicals Average Historicals DCP Financial Projections NYMEX Strip Pricing Case Higher Commodity Prices Lower Commodity Prices 20

Preliminary Draft – Confidential DCP Financial Projections A DCP Financial Projections ($ in millions) For the Years Ending December 31, 2022E-2027E 2022E 2023E 2024E 2025E 2026E 2027E CAGR Gathering & Processing Segment North Region $1,140 $864 $767 $726 $717 $711 (9.0%) South Region 191 147 137 129 128 127 (7.9%) Midcontinent Region 275 239 225 212 209 207 (5.5%) Permian Region 584 585 562 533 527 522 (2.2%) Other G&P -——————- Total Gathering & Processing Gross Margin $2,190 $1,835 $1,690 $1,601 $1,581 $1,568 (6.5%) Total Costs North Region ($157) ($144) ($154) ($154) ($156) ($158) 0.2% South Region (99) (99) (92) (92) (94) (95) (0.8%) Midcontinent Region (165) (162) (174) (174) (177) (179) 1.6% Permian Region (251) (293) (307) (308) (312) (317) 4.7% Other G&P (19) (23) (20) (21) (21) (21) 2.6% Total Gathering & Processing Costs ($691) ($721) ($748) ($748) ($760) ($771) 2.2% Total Gathering & Processing Segment Margin $1,499 $1,113 $942 $852 $821 $797 (11.9%) Logistics & Marketing Segment Southern Hills + Sand Hills $429 $436 $442 $449 $449 $449 0.9% Other NGL Pipelines 141 149 156 158 158 158 2.3% NGL Marketing + Storage 46 49 39 39 39 39 (3.2%) Downstream Fractionation 19 21 21 21 21 21 2.0% Gas Marketing + Other Income 18 13 13 13 13 13 (7.1%) Gas Storage 2 13 12 12 12 12 43.2% Guadalupe 62 48 40 40 40 40 (8.5%) Gulf Coast Express Equity Earnings 66 66 66 66 66 66 (0.0%) Cheyenne Connector Equity Earnings 14 14 14 14 14 14 0.0% Total Logistics & Marketing Gross Margin $798 $810 $804 $812 $812 $812 0.4% Total Costs Logistics & Marketing Costs ($44) ($47) ($41) ($41) ($42) ($42) (0.9%) Total Logistics & Marketing Segment Margin $754 $763 $763 $771 $771 $770 0.4% Source: DCP Management 21

Preliminary Draft – Confidential DCP Financial Projections A DCP Financial Projections – Summary Cash Flows ($ in millions, except per unit amounts) For the Years Ending December 31, 2022E-2027E 2022E 2023E 2024E 2025E 2026E 2027E CAGR Gathering & Processing Segment Margin $1,499 $1,113 $942 $852 $821 $797 (11.9%) Logistics & Marketing Segment Margin 754 763 763 771 771 770 0.4% Less: Corporate Costs (255) (257) (236) (236) (239) (243) (1.0%) Plus: Adj. Distribution in Excess of Equity Earnings—Logistics 77 80 80 80 80 80 0.9% Plus: Adj. Distribution in Excess of Equity Earnings—Discovery 13 9 9 9 9 9 (7.3%) Plus: Hedge settlement (339) (11) 2 (4) -—- Adjusted EBITDA $1,749 $1,698 $1,560 $1,473 $1,442 $1,414 (4.2%) Plus: Growth Projects -—- 18 25 32 39 Total Adjusted EBITDA $1,749 $1,698 $1,578 $1,498 $1,474 $1,453 (3.6%) Less: Interest Expense ($273) ($286) ($258) ($221) ($210) ($183) Less: Preferred Securities (58) (15) -———-Less: Sustaining Capital (135) (150) (150) (125) (125) (125) Less: Income Taxes (5) (5) (5) (5) (5) (5) Less: Other (3) (7) (7) (5) (5) (5) Distributable Cash Flow $1,275 $1,235 $1,157 $1,142 $1,128 $1,135 (2.3%) Identified Organic Capital ($140) $— $— $— $— $—Unidentified Organic Capital — (125) (50) (50) (50) (50) Acquisition Capital (160) -————- Distributions (342) (359) (359) (359) (359) (359) 1.0% Working Capital and Interest Timing (30) 133 90 -——- Cash Surplus / (Shortfall) $603 $884 $838 $733 $719 $726 3.8% LP Units Outstanding 208 209 209 209 209 209 0.0% Distributable Cash Flow per LP Unit $6.12 $5.92 $5.55 $5.47 $5.41 $5.44 (2.3%) Distribution per Unit 1.64 1.72 1.72 1.72 1.72 1.72 1.0% Total Distributions $342 $359 $359 $359 $359 $359 1.0% Source: DCP Management 22

Preliminary Draft – Confidential DCP Financial Projections A DCP Financial Projections – Sources and Uses ($ in millions) For the Years Ending December 31, 2022E 2023E 2024E 2025E 2026E 2027E Sources DCF Surplus / (Shortfall) $603 $884 $838 $733 $719 $726 Revolver Draw 246 -————- Total Sources $849 $884 $838 $733 $719 $726 Uses Revolver Paydown $— $113 $393 $— $— $— Long-Term Debt Paydown 350 500 — 825 — 500 Preferred Equity Redemption 500 271 -———-Cash Balance Increase / (Decrease) (1) — 445 (92) 719 226 Total Uses $849 $884 $838 $733 $719 $726 Memo: Cash $— $— $445 $353 $1,073 $1,298 Total Debt 5,331 4,718 4,325 3,500 3,500 3,000 Net Debt $5,331 $4,718 $3,880 $3,147 $2,427 $1,702 Preferred Equity 271 -————- Net Debt + Preferred Equity $5,602 $4,718 $3,880 $3,147 $2,427 $1,702 Total Debt / Adjusted EBITDA 3.0x 2.8x 2.7x 2.3x 2.4x 2.1x Net Debt / Adjusted EBITDA 3.0 2.8 2.5 2.1 1.6 1.2 (Net Debt + Preferred Equity) / Adjusted EBITDA 3.2 2.8 2.5 2.1 1.6 1.2 Source: DCP Management 23

Preliminary Draft – Confidential DCP Financial Projections B DCP Financial Projections ($ in millions) For the Years Ending December 31, 2022E-2027E 2022E 2023E 2024E 2025E 2026E 2027E CAGR Gathering & Processing Segment North Region $1,140 $729 $752 $758 $756 $756 (7.9%) South Region 191 151 144 138 136 135 (6.8%) Midcontinent Region 275 243 231 218 214 211 (5.2%) Permian Region 584 568 565 542 535 531 (1.9%) Other G&P -——————- Total Gathering & Processing Gross Margin $2,190 $1,691 $1,692 $1,655 $1,641 $1,633 (5.7%) Total Costs North Region ($157) ($144) ($154) ($154) ($156) ($158) 0.2% South Region (99) (99) (92) (92) (94) (95) (0.8%) Midcontinent Region (165) (162) (174) (174) (177) (179) 1.6% Permian Region (251) (293) (307) (308) (312) (317) 4.7% Other G&P (19) (23) (20) (21) (21) (21) 2.6% Total Gathering & Processing Costs ($691) ($721) ($748) ($748) ($760) ($771) 2.2% Total Gathering & Processing Segment Margin $1,499 $970 $944 $907 $881 $862 (10.5%) Logistics & Marketing Segment Southern Hills + Sand Hills $429 $436 $442 $449 $449 $449 0.9% Other NGL Pipelines 141 149 156 158 158 158 2.3% NGL Marketing + Storage 46 49 39 39 39 39 (3.2%) Downstream Fractionation 19 21 21 21 21 21 2.0% Gas Marketing + Other Income 18 13 13 13 13 13 (7.1%) Gas Storage 2 13 12 12 12 12 43.2% Guadalupe 62 48 40 40 40 40 (8.5%) Gulf Coast Express Equity Earnings 66 66 66 66 66 66 (0.0%) Cheyenne Connector Equity Earnings 14 14 14 14 14 14 0.0% Total Logistics & Marketing Gross Margin $798 $810 $804 $812 $812 $812 0.4% Total Costs Logistics & Marketing Costs ($44) ($47) ($41) ($41) ($42) ($42) (0.9%) Total Logistics & Marketing Segment Margin $754 $763 $763 $771 $771 $770 0.4% Source: DCP Management 24

Preliminary Draft – Confidential DCP Financial Projections B DCP Financial Projections – Summary Cash Flows ($ in millions, except per unit amounts) For the Years Ending December 31, 2022E-2027E 2022E 2023E 2024E 2025E 2026E 2027E CAGR Gathering & Processing Segment Margin $1,499 $970 $944 $907 $881 $862 (10.5%) Logistics & Marketing Segment Margin 754 763 763 771 771 770 0.4% Less: Corporate Costs (255) (257) (236) (236) (239) (243) (1.0%) Plus: Adj. Distribution in Excess of Equity Earnings—Logistics 77 80 80 80 80 80 0.9% Plus: Adj. Distribution in Excess of Equity Earnings—Discovery 13 9 9 9 9 9 (7.3%) Plus: Hedge settlement (339) 18 4 (2) -—- Adjusted EBITDA $1,749 $1,583 $1,563 $1,530 $1,501 $1,478 (3.3%) Plus: Growth Projects -—- 18 25 32 39 Total Adjusted EBITDA $1,749 $1,583 $1,581 $1,555 $1,534 $1,518 (2.8%) Less: Interest Expense ($273) ($290) ($261) ($222) ($210) ($183) Less: Preferred Securities (58) (15) -———-Less: Sustaining Capital (135) (150) (150) (125) (125) (125) Less: Income Taxes (5) (5) (5) (5) (5) (5) Less: Other (3) (7) (7) (5) (5) (5) Distributable Cash Flow $1,275 $1,115 $1,158 $1,198 $1,188 $1,199 (1.2%) Identified Organic Capital ($140) $— $— $— $— $—Unidentified Organic Capital — (125) (50) (50) (50) (50) Acquisition Capital (160) -————- Distributions (342) (359) (359) (359) (359) (359) 1.0% Working Capital and Interest Timing (30) 133 90 -——- Cash Surplus / (Shortfall) $603 $764 $839 $789 $779 $790 5.6% LP Units Outstanding 208 209 209 209 209 209 0.0% Distributable Cash Flow per LP Unit $6.12 $5.34 $5.55 $5.74 $5.69 $5.75 (1.2%) Distribution per Unit 1.68 1.72 1.72 1.72 1.72 1.72 0.5% Total Distributions $342 $359 $359 $359 $359 $359 1.0% Source: DCP Management 25

Preliminary Draft – Confidential DCP Financial Projections B DCP Financial Projections – Sources and Uses ($ in millions) For the Years Ending December 31, 2022E 2023E 2024E 2025E 2026E 2027E Sources DCF Surplus / (Shortfall) $603 $764 $839 $789 $779 $790 Revolver Draw 246 7 -———- Total Sources $849 $771 $839 $789 $779 $790 Uses Revolver Paydown $— $— $513 $— $— $— Long-Term Debt Paydown 350 500 — 825 — 500 Preferred Equity Redemption 500 271 -———-Cash Balance Increase / (Decrease) (1) — 327 (36) 779 290 Total Uses $849 $771 $839 $789 $779 $790 Memo: Cash $— $— $327 $291 $1,070 $1,360 Total Debt 5,331 4,838 4,325 3,500 3,500 3,000 Net Debt $5,331 $4,838 $3,998 $3,209 $2,430 $1,640 Preferred Equity 271 -————- Net Debt + Preferred Equity $5,602 $4,838 $3,998 $3,209 $2,430 $1,640 Total Debt / Adjusted EBITDA 3.0x 3.1x 2.7x 2.3x 2.3x 2.0x Net Debt / Adjusted EBITDA 3.0 3.1 2.5 2.1 1.6 1.1 (Net Debt + Preferred Equity) / Adjusted EBITDA 3.2 3.1 2.5 2.1 1.6 1.1 Source: DCP Management 26

Preliminary Draft – Confidential DCP Financial Projections DCP Financial Projections Summary – Comparison to Wall Street Consensus Estimates ($ in millions) Adjusted EBITDA Distributable Cash Flow $1,749 $1,776 $1,750 $1,698 $1,665 $1,665 $1,578 $1,616 $1,634 $1,498 $1,474 $1,453 $1,312 $1,319 $1,274 $1,298 $1,275 $1,235 $1,157$ 1,219 $1,230 $1,142 $1,128 $1,135 2022E 2023E 2024E 2025E 2026E 2027E 2022E 2023E 2024E 2025E 2026E 2027E Distributed Cash Flow Net Debt / Adjusted EBITDA Coverage Ratio: 3.7x 3.4x 3.2x 3.2x 3.1x 3.2x 3.0x 2.7x 2.8x 3.8x 3.5x 3.1x 3.2x 3.2x 3.2x 2.5x 2.4x 2.1x 2.1x 1.6x 1.2x $359$378 $359$396 $359$386 $359$396 $359$406 $342$351 NA NA NA 2022E 2023E 2024E 2025E 2026E 2027E 2022E 2023E 2024E 2025E 2026E 2027E DCP Financial Projections Wall Street Consensus Estimates Source: DCP Management; FactSet; as of January 4, 2023 27
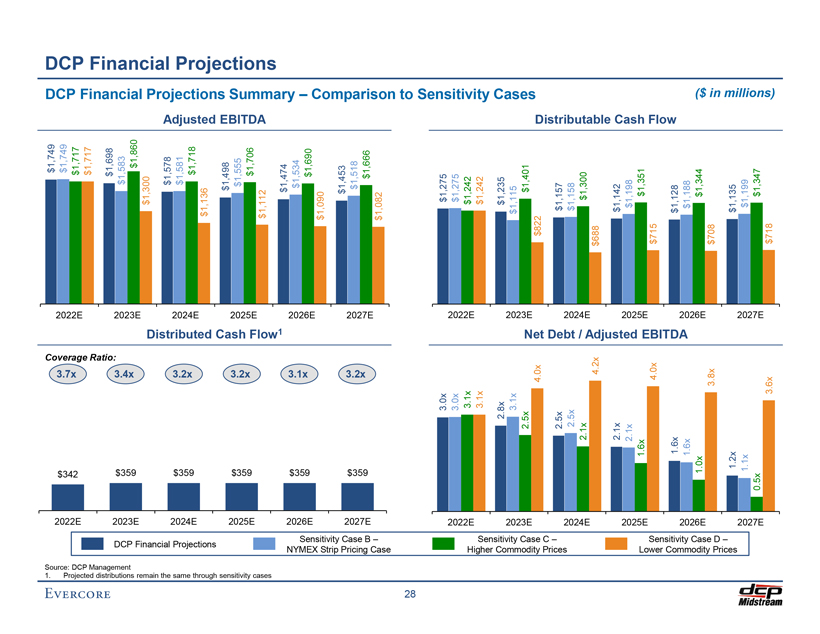
. 1 $1,749 Source: $ . 3 $1,749 342 7x DCP $1,717 DCP 2022E Coverage 2022E DCP Projected $1,717 Ratio: $1,698 Management DCP $ . 3 $1,583 distributions 359 4x $1,860 2023E 2023E Financial remain $1,300 Financial Financial the $1,578 same $ . 3 $1,581 3592x $1,718 2024E 2024E through Projections Distributed $1,136 Adjusted Projections $1,498 $ . 3 Cash $1,555 sensitivity 359 2x 2025E 2025E $1,706 cases Flow $1,112 EBITDA Projections 1 $1,474 $ . 3 Summary $1,534 359 1x – $1,690 NYMEX 2026E 2026E Strip Sensitivity $1,090 $1,453 $ . 3 Case $1,518 Pricing 359 2x $1,666 B 2027E 2027E Case – $1,082 Comparison to 28 3.0x $1,275 3.0x $1,275 2022E 3.1x 2022E $1,242 Higher 3.1x $1,242 Sensitivity 2.8x $1,235 Sensitivity 3.1x $1,115 2.5x Commodity Case 2023E 2023E $1,401 Cases 4.0x $822 Net C – Prices 2.5x $1,157 2.5x Debt $1,158 / 2024E 2.1x 2024E $1,300 4.2x $688 Distributable 2.1x $1,142 2.1x Adjusted $1,198 2025E 1.6x 2025E $1,351 Cash Lower 4.0x $715 Flow Preliminary Sensitivity 1.6x EBITDA $1,128 1.6x $1,188 1.0x $1,344 ( Draft 2026E 2026E $ Commodity Case – D 3.8x $708 in – Prices 1.2x $1,135 1.1x $1,199 2027E 0.5x 2027E $1,347 3.6x $718 millions) Confidential

Preliminary Draft – Confidential IV. Preliminary Valuation of the Common Units

Preliminary Draft – Confidential Preliminary Valuation of the Common Units Valuation Methodologies Evercore utilized the following methodologies to analyze the value of the Common Units: Methodology Description Assumptions / Detail Values the Common Units based on the concept of Projected cash flow discounted to 12/31/22 the time value of money Utilizes varying weighted average cost of capital EBITDA exit multiple based on peer group trading multiples and Discounted (“WACC”) discount rates and applies various precedent transaction multiples Cash Flow perpetuity growth rates to derive after-tax valuation WACC based on the Capital Asset Pricing Model (“CAPM”) Analysis ranges Calculated terminal values based on a range of multiples of EBITDA and assumed perpetuity growth rates Values the Common Units based on the present value Projected distributions discounted to 12/31/22 of the future cash distributions Discounted Terminal yield range based on the distribution yield at which DCP Distributions has traded over the last 52 weeks Analysis Cost of equity based on CAPM and total expected market return for MLPs and companies with similar assets to those of DCP Values the Common Units based on EV/EBITDA and EV/EBITDA multiples applied to 2023E and 2024E EBITDA Peer Group Price/DCF trading multiples Price/DCF LP unit applied to 2023E and 2024E DCF/LP unit Trading Multiples selected based on EV/EBITDA and Analysis Price/DCF multiples of MLPs and companies with assets similar to those owned by DCP Precedent Values the Common Units based on multiples of EV/EBITDA multiples applied to 2022E EBITDA M&A transaction value to EBITDA in historical transactions involving assets similar to those owned by DCP Transaction Analysis For Premiums Values DCP common units based on historical Median 1-Day spot and 20-Day volume weighted average price Reference premiums paid in (i) MLP buy-ins and (ii) MLP mergers (“VWAP”) premiums paid applied to relevant unit prices Only Paid Analysis since 2018 29

Preliminary Draft – Confidential Preliminary Valuation of the Common Units Preliminary Valuation Summary For Reference Only Discounted Peer Group Discounted Cash Flow Analysis Distributions Trading Analysis MLP Analyst Analysis Precedent M&A Premiums Price Transaction Analysis Paid Targets Market Price/DCF Exit Multiple Perpetuity Grow th CAPM EV/EBITDA Return per LP Unit $65.00 $61.07 Implied range based on 5% $55.00 annual $53.18 $52.70 $52.17 distribution growth $50.33 $50.20 $50.20 $49.58 $48.61 $48.61 through $45.40 2027E1 $45.91 $44.37 $45.00 $45.00 $43.31 $44.05 $44.86 $41.61 $40.99 $40.08 $42.24 $38.33 $37.83 $38.44 $39.96 $38.00 $35.00 $34.93 $37.36 $36.05 $35.15 $32.22 $33.35 $33.44 $33.27 $33.41 $33.27 $33.30 $29.52 $33.56 $33.56 $28.75 $32.28 $32.28 $27.68 $28.20 $29.71 $24.22 $25.00 Merger Consideration: $41.75 $25.10 Price as of 1/4/23: $38.59 $19.79 $18.84 $15.00 $16.31 $15.98 $5.00 4.0%—5.0% 7.0%—8.0% WACC Terminal Yield 8.0x—9.0x 6.5x—7.5x Merger 2023E EBITDA 2023E DCF/LP Unit Premium 9.0%—11.0%—Analyst 7.25x—9.25x Selected 10.0% 13.0% Price 8.0x—9.0x 0.5%—1.5% 2022E EBITDA Range: Equity Equity Targets Exit Multiple Perpetuity Grow th Rate 8.0x—9.0x 6.0x—7.0x 15.0%—Cost of Cost of 2024E EBITDA 2024E DCF/LP Unit 30.0% Capital Capital Sensitivity Case B – Sensitivity Case C – Sensitivity Case D –DCP Financial Projections NYMEX Strip Pricing Case Higher Commodity Prices Lower Commodity Prices 1. For reference only: sensitivity case using a 5% annual distribution growth rate which assumes lower than the commodity super cycle board assumption of 7.5% growth and higher than DCP Financial Projections’ 0% growth 30

Preliminary Draft – Confidential Preliminary Valuation of the Common Units A Discounted Cash Flow Analysis ($ in millions, except per unit amounts) Summary Results For the Years Ending December 31, Exit Perpetuity 2023E 2024E 2025E 2026E 2027E Multiple Growth Adjusted EBITDA $1,698 $1,578 $1,498 $1,474 $1,453 $1,453 $1,453 Less: Tax Depreciation and Amortization¹ (14,251) (154) (127) (118) (116) (125) EBIT ($12,553) $1,424 $1,371 $1,356 $1,338 $1,328 Less: Cash Taxes — (84) (81) (100) (99) (491) EBIAT ($12,553) $1,340 $1,290 $1,255 $1,239 $837 Plus: Tax Depreciation and Amortization 14,251 154 127 118 116 125 Less: Maintenance Capex (150) (150) (125) (125) (125) (125) Less: Growth Capex (125) (50) (50) (50) (50) —Unlevered Free Cash Flow $1,423 $1,293 $1,242 $1,199 $1,179 $837 EBITDA Multiple / Perpetuity Growth Rate 8.5x 1.0% Implied Terminal Value $12,351 $13,000 Present Value of Terminal Value @ 7.5% Discount Rate $8,603 $8,734 Plus: Present Value of Unlevered Free Cash Flow @ 7.5% Discount Rate 5,351 Implied Enterprise Value $13,954 $14,085 Less: Preferred Equity2 ($271) Less: Net Debt2 (5,331) Less: Noncontrolling Interests2 (25) Implied Equity Value $8,327 $8,458 DCP Units Outstanding3 210 Implied Value per Unit $39.61 $40.23 Sensitivity Analysis Terminal Exit Multiple Perpetuity Growth Rate 7.5x 8.0x 8.5x 9.0x 9.5x —% 0.5% 1.0% 1.5% 2.0% 6.5% $37.07 $39.59 $42.11 $44.63 $47.16 6.5% $42.54 $46.38 $50.92 $56.37 $63.03 C C 7.0% 35.92 38.38 40.84 43.31 45.77 C C 7.0% 38.14 41.37 45.13 49.58 54.92 WA 7.5% 34.79 37.20 39.61 42.02 44.42 WA 7.5% 34.34 37.07 40.23 43.92 48.27 8.0% 33.70 36.05 38.40 40.76 43.11 8.0% 31.00 33.35 36.03 39.12 42.73 8.5% 32.64 34.93 37.23 39.53 41.83 8.5% 28.05 30.08 32.38 35.00 38.03 31 1. 2023E tax DD&A assumes 80% bonus depreciation calculated as the midpoint of the enterprise value range plus 2023E capital expenditures 2. Per DCP Management as of December 31, 2022 3. Includes 117.8mm common units held by DCP Midstream, LLC and DCP Midstream GP, LP, and 1.8mm phantom and performance units

Preliminary Draft – Confidential Preliminary Valuation of the Common Units Discounted Distribution Analysis For the Years Ending December 31, Terminal Value 2023E 2024E 2025E 2026E 2027E Low High DCP Distribution per Unit (Cash, As Paid) $1.72 $1.72 $1.72 $1.72 $1.72 $1.72 – $1.72 Terminal Yield1 5.0% 4.0% Terminal Value $34.40 $43.00 Equity Cost of Capital Based on CAPM Present Value @ 8.5% Cost of Equity $29.94 – $35.66 Present Value @ 9.0% Cost of Equity 29.34 – 34.93 Present Value @ 9.5% Cost of Equity 28.76 – 34.23 Present Value @ 10.0% Cost of Equity 28.20 – 33.54 Present Value @ 10.5% Cost of Equity 27.65 – 32.87 Implied DCP Unit Value – Based on CAPM $28.20 – $34.93 Equity Cost of Capital Based on Total Expected Market Return2 Present Value @ 10.0% Cost of Equity $28.20 – $33.54 Present Value @ 11.0% Cost of Equity 27.11 – 32.22 Present Value @ 12.0% Cost of Equity 26.08 – 30.96 Present Value @ 13.0% Cost of Equity 25.10 – 29.77 Present Value @ 14.0% Cost of Equity 24.17 – 28.64 Implied DCP Unit Value – Based on Total Expected Market Return $25.10 – $32.22 Source: DCP Management 1. Based on DCP’s 52-week yield range of 2.6% to 5.6% with a median of 4.3% and mean of 4.3%; Current yield is 4.0% as of January 4, 2023 2. Detail on Equity Cost of Capital calculations in Appendix 32

Preliminary Draft – Confidential Preliminary Valuation of the Common Units Discounted Distribution Analysis – 5% Annual Distribution Growth For Reference Only For the Years Ending December 31, Terminal Value 2023E 2024E 2025E 2026E 2027E Low High DCP Distribution per Unit (Cash, As Paid) $1.72 $1.81 $1.90 $1.99 $2.09 $2.09 – $2.09 Distribution Growth 5.0% 5.0% 5.0% 5.0% Terminal Yield1 5.0% 4.0% Terminal Value $41.80 $52.25 Equity Cost of Capital Based on CAPM Present Value @ 8.5% Cost of Equity $35.54 – $42.49 Present Value @ 9.0% Cost of Equity 34.82 – 41.61 Present Value @ 9.5% Cost of Equity 34.12 – 40.76 Present Value @ 10.0% Cost of Equity 33.44 – 39.93 Present Value @ 10.5% Cost of Equity 32.78 – 39.12 Implied DCP Unit Value – Based on CAPM $33.44 – $41.61 Equity Cost of Capital Based on Total Expected Market Return2 Present Value @ 10.0% Cost of Equity $33.44 – $39.93 Present Value @ 11.0% Cost of Equity 32.13 – 38.33 Present Value @ 12.0% Cost of Equity 30.89 – 36.82 Present Value @ 13.0% Cost of Equity 29.71 – 35.38 Present Value @ 14.0% Cost of Equity 28.59 – 34.01 Implied DCP Unit Value – Based on Total Expected Market Return $29.71 – $38.33 Source: DCP Management Note: Sensitivity case using a 5% annual distribution growth rate which assumes lower than the commodity super cycle board assumption of 7.5% growth and management 0% growth scenarios 1. Based on DCP’s 52-week yield range of 2.6% to 5.6% with a median of 4.3% and mean of 4.3%; Current yield is 4.0% as of January 4, 2023 2. Detail on Equity Cost of Capital calculations in Appendix 33

Preliminary Draft – Confidential Preliminary Valuation of the Common Units Peer Group Trading Analysis ($ in millions, except per unit/share amounts) Price/DCF Price Equity Enterprise Enterprise Value/EBITDA / CAFD per Share Distribution Yield Dist. Net Debt / Parthership / Company 1/4/23 Value Value 2023E 2024E 2023E 2024E Current 2023E Growth 2023E EBITDA Gathering & Processing MLPs/Companies Antero Midstream Corporation $10.89 $5,269 $8,639 9.1x 8.6x 9.1x 8.1x 8.3% 8.3% NM 3.5x Crestwood Equity Partners LP 26.56 2,859 7,263 8.0 7.6 4.8 4.4 9.9% 9.9% 3.7% 3.7 DT Midstream, Inc. 53.65 5,256 8,658 9.6 9.0 8.8 8.3 4.8% 5.0% 6.9% 3.6 EnLink Midstream, LLC 11.95 5,788 11,984 8.8 8.6 5.7 5.4 3.8% 4.2% 10.0% 3.4 Equitrans Midstream Corporation 6.85 2,997 10,441 9.9 9.1 5.4 5.0 8.8% 8.8% 0.8% 6.0 Hess Midstream Partners LP 30.02 7,205 10,111 9.7 9.2 8.3 7.9 7.5% 7.9% 4.0% 2.8 Kinetik Holdings Inc. 31.53 4,331 7,770 8.7 7.8 6.0 5.3 9.5% 10.0% 4.3% 3.8 ONEOK, Inc. 64.44 28,915 41,768 10.5 10.2 11.7 11.2 5.8% 5.8% 4.0% 3.2 Summit Midstream Partners, LP 16.51 174 1,905 6.3 6.1 NM NM —% —% NM 5.1 Targa Resources Corp. 71.03 16,403 30,825 8.9 8.7 6.4 6.3 2.0% 2.4% 10.0% 3.5 Western Midstream Partners, LP 25.89 10,267 17,076 7.7 7.5 6.8 6.2 7.7% 7.7% 10.9% 3.0 Mean 8.8x 8.4x 7.3x 6.8x 6.2% 6.4% 6.1% 3.8x Median 8.9 8.6 6.6 6.2 7.5% 7.7% 4.3% 3.5 DCP Midstream, LP (Consensus)1 $38.59 $8,066 $13,582 7.8x 8.2x 6.3x 6.6x 4.5% 4.7% 3.1% 2.7x DCP Midstream, LP (DCP Financial Projections)1 $38.59 $8,066 $13,582 8.0x 8.6x 6.5x 7.0x 4.5% 4.5% —% 3.0x Source: Company filings, FactSet, Wall Street Research; as of January 4, 2023 34

Preliminary Draft – Confidential Preliminary Valuation of the Common Units Change in Valuation Multiples Over Time EV / NTM EBITDA Multiples1 14.0x 0.8x Average Differential from Peers Since 1/1/2018 1.2x Average Differential from Peers Since 1/1/2022 12.0x 10.0x 8.9x 8.0x 7.8x 6.0x 4.0x 2.0x --x 1/1/18 11/1/18 9/2/19 7/3/20 5/4/21 3/5/22 1/4/23 DCP Peer Median2 Source: FactSet market data as of January 4, 2023 1. EV / NTM EBITDA based on FactSet Consensus trading multiples 2. Peers include AM, CEQP, DTM, ENLC, ETRN, HESM, KNTK, OKE, SMLP, TRGP and WES 35

Preliminary Draft – Confidential Preliminary Valuation of the Common Units A Peer Group Trading Analysis – EV/EBITDA ($ in millions, except per unit amounts) 2023E Adjusted EBITDA $1,698 Relevant EBITDA Multiple 8.0x—9.0x Implied Enterprise Value Based on 2023E Adjusted EBITDA $13,582—$15,280 Less: Preferred Equity1 (271) Less: Net Debt1 (5,331) Less: Noncontrolling Interests1 (25) Implied Equity Value $7,955—$9,652 DCP Units Outstanding 210 Implied DCP Unit Price Range—2023E EBITDA $37.84—$45.91 2024E Adjusted EBITDA $1,578 Relevant EBITDA Multiple 8.0x—9.0x Implied Enterprise Value Based on 2024E Adjusted EBITDA $12,621—$14,199 Less: Preferred Equity1 (271) Less: Net Debt1 (5,331) Less: Noncontrolling Interests1 (25) Implied Equity Value $6,994—$8,572 DCP Units Outstanding 210 Implied DCP Unit Price Range—2024E EBITDA $33.27—$40.77 Implied DCP Unit Price Range—2023E and 2024E EBITDA $33.27—$45.91 1. As of December 31, 2022 36

Preliminary Draft – Confidential Preliminary Valuation of the Common Units A Peer Group Trading Analysis – Price/DCF per LP Unit ($ in millions, except per unit amounts) 2023E DCF / LP Unit $5.92 Relevant Multiple 6.5x—7.5x Implied DCP Unit Price Range—2023E Price / DCF $38.45—$44.37 2024E DCF / LP Unit $5.55 Relevant Multiple 6.0x—7.0x Implied DCP Unit Price Range—2024E Price / DCF $33.27—$38.82 Implied DCP Unit Price Range—2023E and 2024E Price / DCF $33.27—$44.37 37

Preliminary Draft – Confidential Preliminary Valuation of the Common Units Precedent M&A Transaction Analysis ($ in millions) Gathering & Processing Transactions Date Transaction EBITDA Announced Acquiror / Target (Seller) Value ($MM) Multiple Oct-22 Summit Midstream / Outrigger DJ Midstream $165 6.8x Oct-22 Summit Midstream / Sterling DJ 140 3.0 Sep-22 Antero Midstream / Marcellus G&P System (Crestwood Equity Partners) 205 7.0 Jun-22 Targa Resources / Lucid Energy 3,550 7.5 Jun-22 DCP Midstream / James Lake System (Woodland Midstream II) 160 5.5 May-22 EnLink Midstream / Barnett Gathering and Processing System (Crestwood Equity Partners) 275 4.0 May-22 Crestwood Equity Partners / Sendero Midstream 600 7.0 Apr-22 Delek Logistics Partners / 3Bear Energy 625 8.8 Mar-22 Targa Resources / Southcross Energy Operating 200 4.0 Mar-22 Williams Companies / Trace Midstream 950 6.0 Jan-22 Enterprise Products Partners / Navitas Midstream Partners 3,250 7.8 Oct-21 Crestwood Equity Partners / Oasis Midstream 1,848 8.3 Oct-21 Altus Midstream / BCP Raptor/EagleClaw Midstream 6,248 11.7 Apr-21 EnLink Midstream LLC / Amarillo Rattler JV (Rattler Midstream Partners LP, Amarillo Midstream) 60 6.0 Aug-20 Citizen Energy II LLC / Blue Mountain Midstream LLC (Riviera Resources, Inc.) 111 7.1 Jul-20 CNX Resources Corporation / 46.9% stake in CNX Midstream Partners LP 728 7.7 Feb-20 Equitrans Midstream Corporation / EQM Midstream Partners 1,762 8.3 Mean 6.8x Median 7.0 Min 3.0 Max 11.7 Source: Public filings, FactSet 38

Preliminary Draft – Confidential Preliminary Valuation of the Common Units Precedent M&A Transaction Analysis (cont’d) ($ in millions) Natural Gas Transportation Transactions Date Transaction EBITDA Announced Acquiror / Target (Seller) Value ($MM) Multiple Dec-22 Williams Companies / MountainWest (Southwest Gas Holdings) $1,500 8.0x Sep-22 DT Midstream / 26.25% Ownership Interest in Millennium Pipeline (National Grid) 552 10.0 Jun-21 Kinder Morgan / Stagecoach Gas Services (Crestwood Equity Partners LP, Consolidated Edison Inc) 857 10.7 Feb-21 ArcLight Capital Partners LLC / 25% Interest in Natural Gas Pipeline Company of America LLC (Kinder Morgan) 1,300 11.2 Jul-20 Berkshire Hathaway Energy / Dominion Energy Natural Gas Transmission and Storage Business 9,700 9.7 Mar-20 ATCO Gas and Pipelines Ltd / Pioneer Pipeline (Tidewater Midstream and Infrastructure Ltd. & TransAlta Corp.) 184 NA Feb-20 Equitrans Midstream Corporation / EQM Midstream Partners, LP 1,762 8.3 Sep-19 NextEra Energy Partners, LP / Meade Pipeline Co LLC 1,280 11.6 Sep-19 Kinder Morgan / Corpus Christi Pipeline Network (Southcross) 76 9.0 Jan-19 NEXUS Gas Transmission, LLC (Enbridge Inc.; DTE Energy Company) / Generation Pipeline LLC 160 14.4 Feb-18 Tallgrass Energy GP, LP / 25.01% interest in Rockies Express Pipeline LLC (Tallgrass Development LP) 1,044 6.4 Nov-17 American Midstream Partners, LP / Trans-Union Interstate Pipeline (ArcLight Capital Partners, LLC) 48 6.5 Jul-17 Blackstone Energy Partners / 32.44% interest in Rover Pipeline (Energy Transfer Partners, LP) 1,571 10.7 TC Pipelines / 49.3% interest in Iroquois Gas Transmission System, LP and 11.8% interest in Portland Natural Gas Transmission (TransCanada Jun-17 765 10.9 Corp.) Apr-17 Tallgrass Energy Partners, LP / 24.99% interest in Rockies Express Pipeline LLC (Tallgrass Development, LP) 1,043 6.6 Mean 9.6x Median 9.9 Min 6.4 Max 14.4 Source: Public filings, FactSet 39

Preliminary Draft – Confidential Preliminary Valuation of the Common Units Precedent M&A Transaction Analysis (cont’d) ($ in millions) NGL and NGL-Related Transportation Transactions Date Transaction EBITDA Announced Acquiror / Target (Seller) Value ($MM) Multiple Jan-23 Targa Resources Corp / 25% interest in Grand Prix Pipeline (Blackstone Energy Partners) $1,050 8.8x Mar-22 ArcLight / 25% Interest in Gulf Coast Express Pipeline (Targa Resources) 857 11.1 Oct-21 Phillips 66 / Phillips 66 Partners 14,400 10.1 Aug-19 Pembina Pipeline Corporation / Cochin Pipeline (Kinder Morgan) 1,546 13.0 Jul-19 Altus Midstream / 33.0% interest in Shin Oak Pipeline (Enterprise Products Partners L.P.) 1,336 13.8 Oct-17 Blackstone Energy Partners / 25% interest in Grand Prix Pipeline (Targa Resources Corp) 325 10.0 Oct-16 Phillips 66 Partners LP / 30 crude oil, refined products and NGL logistics assets (Phillips 66) 1,300 8.7 Jun-16 Riverstone Investment Group LLC / 50% Partner Interest in Utopia Pipeline Project (Kinder Morgan, Inc.) 300 12.0 May-16 Phillips 66 Partners LP / Standish Pipeline and remaining 75% in Phillips 66 Sweeny Frac LLC (Phillips 66) 1,033 8.6 Mean 10.7x Median 10.1 Min 8.6 Max 13.8 Source: Public filings, FactSet 40

Preliminary Draft – Confidential Preliminary Valuation of the Common Units A Precedent M&A Transaction Analysis – EV/EBITDA ($ in millions, except per unit amounts) 2022E Adjusted EBITDA $1,749 Relevant EBITDA Multiple 7.25x—9.25x Implied Enterprise Value Based on 2022E Adjusted EBITDA $12,682—$16,180 Less: Preferred Equity1 (271) Less: Net Debt1 (5,331) Less: Noncontrolling Interests1 (25) Implied Equity Value $7,055—$10,553 DCP Units Outstanding 210 Implied DCP Unit Price Range—2022E EBITDA $33.56—$50.20 1. As of December 31, 2022 41

Preliminary Draft – Confidential Preliminary Valuation of the Common Units Premiums Paid Analysis Premium1 Date 1-Day 20-Day Announced Acquiror / Target Consideration Prior Spot VWAP 07/28/22 PBF Energy, Inc. / PBF Logistics LP Cash/Stock-for-Unit (3.0%) 9.5% 07/25/22 Shell USA, Inc. / Shell Midstream Partners, L.P. Cash-for-Unit 23.0% 23.6% 06/02/22 Hartree Partners, LP / Sprague Resources LP Cash-for-Unit 25.2% 27.0% 05/25/22 Höegh LNG Holdings Ltd / Höegh LNG Partners LP Cash-for-Unit 35.0% 42.2% 05/16/22 Diamondback Energy / Rattler Midstream LP Stock-for-Unit 17.3% 10.3% 04/22/22 Ergon, Inc. / Blueknight Energy Partners, L.P. Cash-for-Unit 51.5% 47.5% 12/20/21 BP p.l.c / BP Midstream Partners LP Stock-for-Unit 10.8% 4.0% 10/27/21 Phillips 66 / Phillips 66 Partners LP Stock-for-Unit 4.8% 6.7% 10/04/21 Stonepeak Infrastructure Partners / Teekay LNG Partners LP Cash-for-Unit 8.3% 5.3% 08/23/21 Landmark Dividend / Landmark Infrastructure Partners LP Cash-for-Unit 38.4% 35.0% 03/05/21 Chevron Corporation / Noble Midstream Partners LP Stock-for-Unit 16.7% 18.0% 12/15/20 TC Energy Corporation / TC PipeLines, LP Stock-for-Unit 19.5% 15.5% 07/27/20 CNX Resources Corporation / CNX Midstream Partners Stock-for-Unit 28.1% 3.9% 02/27/20 Equitrans Midstream Corporation / EQM Midstream Partners, LP Stock-for-Unit (1.5%) (5.6%) 12/17/19 Blackstone Infrastructure Partners / Tallgrass Energy LP Cash-for-Unit 56.4% 33.9% 10/01/19 Brookfield Business Partners L.P. / Teekay Offshore Partners L.P. Cash-for-Unit 28.1% 15.1% 09/16/19 Energy Transfer LP / SemGroup Corporation Cash/Unit-for-Share 65.4% 87.3% 08/21/19 Pembina Pipeline Corporation / Kinder Morgan Canada Limited Share-for-Share 37.7% 34.7% 05/10/19 IFM Investors / Buckeye Partners, L.P. Cash-for-Unit 27.5% 23.8% 05/08/19 MPLX LP / Andeavor (Marathon Petroleum Corporation; Andeavor Logistics LP) Unit-for-Unit 1.8% 1.3% 04/02/19 UGI Corporation / AmeriGas Partners, L.P. Cash/Stock-for-Unit 13.5% 22.2% 03/18/19 ArcLight Energy Partners Fund V, L.P. / American Midstream, LP Cash-for-Unit 31.2% 31.2% 02/05/19 SunCoke Energy, Inc. / SunCoke Energy Partners, L.P. Stock-for-Unit 9.3% 19.5% 11/26/18 ArcLight Energy Partners Fund VI, L.P. / TransMontaigne Partners L.P. Cash-for-Unit 12.6% 9.2% 11/08/18 Western Gas Equity Partners, LP / Western Gas Partners, LP Unit-for-Unit 7.6% 62.4% 10/22/18 EnLink Midstream, LLC / EnLink Midstream Partners, LP Unit-for-Unit 1.1% (0.5%) 10/18/18 Valero Energy Corporation / Valero Energy Partners LP Cash-for-Unit 6.0% 9.4% 10/09/18 Antero Midstream GP LP / Antero Midstream Partners LP Cash/Stock-for-Unit 63.7% 54.6% Min (3.0%) (5.6%) Median 18.4% 18.8% All Transactions Mean 22.7% 23.1% Max 65.4% 87.3% Min 6.0% 5.3% Median 27.8% 25.4% Cash-for-Unit Mean 28.6% 25.3% Max 56.4% 47.5% Source: Bloomberg, FactSet, Public filings 1. VWAP premiums paid are calculated by dividing the value of the offer, defined as the exchange ratio multiplied by the closing price of the acquiror’s shares / units on the last trading day prior to announcement plus any cash received, by the 20-trading day VWAP of the target as calculated from the last undisturbed trading day prior to the announcement 42

Preliminary Draft – Confidential Preliminary Valuation of the Common Units Premiums Paid Analysis (cont’d) For Reference Only Summary Results – Cash-for-Unit Transactions 1-Day Prior Spot 20-Day VWAP Unit Price as of 8/17/22 $34.75 $33.88 Historical Merger Premium Range 6.0% — 56.4% 5.3% — 47.5% Implied DCP Unit Price Range $36.84 — $54.36 $35.67 — $49.97 Merger Premium Selected Range 15.0% 30.0% Median-Implied DCP Unit Value $39.96 $44.05 Source: FactSet 43

Preliminary Draft – Confidential Preliminary Valuation of the Common Units Net Present Value of PSX/DCP Operational Efficiencies ($ in millions, except per unit amounts) For Reference Only For the Years Ending December 31, Terminal 2023E 2024E 2025E 2026E 2027E Value Net Operational Efficiencies ($34) $93 $93 $93 $93 $93 Terminal Multiple 8.0x Implied Terminal Value $744 Present Value of Terminal Value @ 13.0% Discount Rate $404 Plus: Present Value of Unlevered Free Cash Flow @ 13.0% Discount Rate 229 Implied NPV of Operational Efficiencies $633 DCP Units Outstanding1 210 Implied Value per Unit $3.01 Value Per NPV of Operational Efficiencies Based on a Range of Discount Rates NPV DCP Unit Present Value @ 10.0% Discount Rate $711 $3.38 Present Value @ 11.0% Discount Rate 684 3.25 Present Value @ 12.0% Discount Rate 657 3.13 Present Value @ 13.0% Discount Rate 633 3.01 Present Value @ 14.0% Discount Rate 609 2.90 Present Value @ 15.0% Discount Rate 586 2.79 Source: DCP Management 1. Includes 117.8mm common units held by DCP Midstream, LLC and DCP Midstream GP, LP, and 1.8mm phantom and performance units 44

Preliminary Draft – Confidential Appendix

Preliminary Draft – Confidential A. Weighted Average Cost of Capital Analysis

Preliminary Draft – Confidential Weighted Average Cost of Capital Analysis DCP Common Units – Capital Asset Pricing Model ($ in millions, except per unit/share amounts) Unit/Share Price Market Equity Total Debt and Total Debt / Adjusted Unlevered 1/4/23 Value Preferred Equity Capitalization Beta 1 2 Partnership/Corporation Total Beta Antero Midstream Corporation $10.89 $5,269 $3,370 39.0% 0.81 0.54 Crestwood Equity Partners LP 26.56 2,859 4,182 59.4% 0.63 0.31 EnLink Midstream, LLC 11.95 5,788 4,579 44.2% 0.99 0.61 Equitrans Midstream Corporation 6.85 2,997 7,014 70.1% 0.94 0.33 Hess Midstream Partners LP 30.02 7,205 2,909 28.8% 0.76 0.59 Kinetik Holdings Inc. 31.53 4,331 3,448 44.3% 0.73 0.45 CAPM ONEOK, Inc. 64.44 28,915 12,876 30.8% 1.04 0.77 Summit Midstream Partners, LP 16.51 174 1,728 90.9% 0.91 0.11 Targa Resources Corp. 71.03 16,403 13,210 44.6% 0.92 0.56 Western Midstream Partners, LP 25.89 10,267 7,095 40.9% 0.90 0.60 Mean 49.3% 0.86 0.49 Median 44.2% 0.90 0.55 DCP Midstream, LP $38.59 $8,066 $5,584 40.9% 0.73 0.49 Risk-free Rate 3 4.0% Unlevered Beta 0.49 Debt and Preferred / Total Capitalization 40.9% Adjusted Levered Equity Beta 0.73 DCP Midstream Cost of Debt7 Supply-Side MRP Historical MRP 4 Yield-to-Worst WACC Market Risk Premium (“MRP”) 6.2% 7.5% Small Company Risk Premium 5 0.7% DCP Midstream 5.600% Senior Notes Due 2044 6.10% Equity Cost of Capital 6 9.2% 10.1% U.S. Treasury Note Due 2042 3.97% 7 5.9% Less: U.S. Treasury Note Due 2044 4.13% Pre-Tax Cost of Debt (0.16%) After-Tax Cost of Debt 8 4.2% WACC 7.2% 7.7% DCP Midstream Implied 20-Year Cost of Debt 5.94% Equity Cost of Capital Sensitivity WACC Sensitivity (Supply-Side / Historical) (Supply-Side / Historical) Debt and Preferred / Total Capitalization Debt and Preferred / Total Capitalization 45.0% 50.0% 55.0% 60.0% 65.0% 45.0% 50.0% 55.0% 60.0% 65.0% ed 0.45 6.9% / 7.4% 6.8% / 7.3% 6.8% / 7.2% 6.7% / 7.1% 6.6% / 7.1% ed 0.45 9.1% / 10.0% 9.4% / 10.4% 9.9% / 10.9% 10.4% / 11.6% 11.1% / 12.4% r 0.50 7.2% / 7.7% 7.1% / 7.6% 7.0% / 7.5% 6.9% / 7.5% 6.9% / 7.4% r 0.50 9.6% / 10.6% 10.0% / 11.0% 10.5% / 11.6% 11.1% / 12.3% 11.9% / 13.3% Beta 0.55 7.4% / 8.0% 7.3% / 7.9% 7.3% / 7.8% 7.2% / 7.8% 7.1% / 7.7% Beta 0.55 10.1% / 11.1% 10.5% / 11.7% 11.0% / 12.3% 11.7% / 13.1% 12.6% / 14.1% nleve U 0.60 7.7% / 8.3% 7.6% / 8.2% 7.5% / 8.2% 7.5% / 8.1% 7.4% / 8.0% nleve U 0.60 10.6% / 11.7% 11.0% / 12.3% 11.6% / 13.0% 12.4% / 13.9% 13.3% / 15.0% 0.65 8.0% / 8.7% 7.9% / 8.6% 7.8% / 8.5% 7.7% / 8.4% 7.6% / 8.3% 0.65 11.1% / 12.3% 11.6% / 12.9% 12.2% / 13.7% 13.0% / 14.6% 14.0% / 15.9% 1. Source: Predicted raw betas from FactSet; Adjusted Equity Beta calculated as: (0.67) × Raw Beta +(0.33) × 1.0 2. Unlevered Beta calculated as: Adjusted Equity Beta × (E/(E + D × (1-T)); Assumes corporate tax rate of 29.6% for partnerships and 21.0% for corporations 3. 20-year Treasury as of January 4, 2023 4. Source: Duff & Phelps 5. Decile: Mid Cap (5) with equity value range of $6,743.4 million to $13,177.8 million 6. Equity Cost of Capital calculated as: Risk-free rate + (Levered Equity Beta × Market Risk Premium) + Small Company Risk Premium 7. Implied DCP 20-year cost of debt based on the yield-to-worst of DCP’s 5.600% Senior Notes Due 2044 adjusted for 20-year maturity using the implied yield spread from relevant U.S. treasury notes 8. Assumes U.S. individual partnership income tax structure through 2025 of 80.0% of income taxable at highest tax rate of 37.0%, or 29.6% 45

Preliminary Draft – Confidential Weighted Average Cost of Capital Analysis DCP Common Units – Total Expected Market Return ($ in millions, except per unit/share amounts) Unit/Share Price Market Equity Distribution/Dividend Total Partnership/Corporation 1/4/23 Value Current Yield Growth Return Antero Midstream Corporation $10.89 $5,269 8.3% —% 8.3% Crestwood Equity Partners LP 26.56 2,859 9.9% 3.7% 13.6% EnLink Midstream, LLC 11.95 5,788 3.8% 10.0% 13.8% Equitrans Midstream Corporation 6.85 2,997 8.8% 0.8% 9.6% Total Hess Midstream Partners LP 30.02 7,205 7.5% 4.0% 11.5% Expected Kinetik Holdings Inc. 31.53 4,331 9.5% 4.3% 13.8% Market ONEOK, Inc. 64.44 28,915 5.8% 4.0% 9.8% Return Targa Resources Corp. 71.03 16,403 2.0% 10.0% 12.0% Western Midstream Partners, LP 25.89 10,267 7.7% 10.9% 18.7% Mean 12.3% Median 12.0% DCP Midstream, LP $38.59 $8,066 4.5% 3.1% 7.6% WACC Debt and Preferred / Total Capitalization 40.9% Market Required Equity Return 12.0% WACC Pre-Tax Cost of Debt1 5.9% After-Tax Cost of Debt2 4.2% DCP Cost of Debt1 WACC 8.8% Yield-to-Worst DCP Midstream 5.600% Senior Notes Due 2044 6.10% U.S. Treasury Note Due 2042 3.97% Less: U.S. Treasury Note Due 2044 4.13% (0.16%) DCP Midstream Implied 20-Year Cost of Debt 5.94% 1. Implied DCP 20-year cost of debt based on the yield-to-worst of DCP’s 5.600% Senior Notes Due 2044 Adjusted for 20-year maturity using the implied yield spread from relevant U.S. treasury notes 2. Assumes U.S. individual partnership income tax structure through 2025 of 80.0% of income taxable at highest tax rate of 37.0%, or 29.6% 46

Preliminary Draft – Confidential B. Supplemental Valuation Materials

Preliminary Draft – Confidential B Sensitivity Case B – NYMEX Strip Pricing

Preliminary Draft – Confidential Supplemental Valuation Materials – NYMEX Strip Pricing B Discounted Cash Flow Analysis ($ in millions, except per unit amounts) Summary Results For the Years Ending December 31, Exit Perpetuity 2023E 2024E 2025E 2026E 2027E Multiple Growth Adjusted EBITDA $1,583 $1,581 $1,555 $1,534 $1,518 $1,518 $1,518 Less: Tax Depreciation and Amortization¹ (14,678) (154) (127) (118) (116) (125) EBIT ($13,096) $1,428 $1,428 $1,415 $1,402 $1,393 Less: Cash Taxes — (85) (85) (105) (104) (515) EBIAT ($13,096) $1,343 $1,343 $1,311 $1,299 $877 Plus: Tax Depreciation and Amortization 14,678 154 127 118 116 125 Less: Maintenance Capex (150) (150) (125) (125) (125) (125) Less: Growth Capex (125) (50) (50) (50) (50) —Unlevered Free Cash Flow $1,308 $1,297 $1,295 $1,254 $1,239 $877 EBITDA Multiple / Perpetuity Growth Rate 8.5x 1.0% Implied Terminal Value $12,901 $13,634 Present Value of Terminal Value @ 7.5% Discount Rate $8,986 $9,160 Plus: Present Value of Unlevered Free Cash Flow @ 7.5% Discount Rate 5,374 Implied Enterprise Value $14,361 $14,534 Less: Preferred Equity2 ($271) Less: Net Debt2 (5,331) Less: Noncontrolling Interests2 (25) Implied Equity Value $8,734 $8,907 DCP Units Outstanding3 210 Implied Value per Unit $41.54 $42.37 Sensitivity Analysis Terminal Exit Multiple Perpetuity Growth Rate 7.5x 8.0x 8.5x 9.0x 9.5x —% 0.5% 1.0% 1.5% 2.0% 6.5% $38.88 $41.52 $44.15 $46.79 $49.42 6.5% $44.77 $48.81 $53.57 $59.28 $66.27 7.0% 37.68 40.26 42.83 45.40 47.98 7.0% 40.17 43.56 47.50 52.17 57.76 WACC 7.5% 36.51 39.03 41.54 44.06 46.57 WACC 7.5% 36.18 39.05 42.37 46.23 50.80 8.0% 35.37 37.83 40.29 42.74 45.20 8.0% 32.69 35.15 37.96 41.20 44.99 8.5% 34.26 36.66 39.06 41.47 43.87 8.5% 29.60 31.73 34.14 36.89 40.07 47 1. 2023E tax DD&A assumes 80% bonus depreciation calculated as the midpoint of the enterprise value range plus 2023E capital expenditures 2. Per DCP Management as of December 31, 2022 3. Includes 117.8mm common units held by DCP Midstream, LLC and DCP Midstream GP, LP, and 1.8mm phantom and performance units

Preliminary Draft – Confidential Supplemental Valuation Materials – NYMEX Strip Pricing B Peer Group Trading Analysis – EV/EBITDA ($ in millions, except per unit amounts) 2023E Adjusted EBITDA $1,583 Relevant EBITDA Multiple 8.0x—9.0x Implied Enterprise Value Based on 2023E Adjusted EBITDA $12,661—$14,244 Less: Preferred Equity1 (271) Less: Net Debt1 (5,331) Less: Noncontrolling Interests1 (25) Implied Equity Value $7,034—$8,617 DCP Units Outstanding 210 Implied DCP Unit Price Range—2023E EBITDA $33.46—$40.99 2024E Adjusted EBITDA $1,581 Relevant EBITDA Multiple 8.0x—9.0x Implied Enterprise Value Based on 2024E Adjusted EBITDA $12,651—$14,232 Less: Preferred Equity1 (271) Less: Net Debt1 (5,331) Less: Noncontrolling Interests1 (25) Implied Equity Value $7,024—$8,605 DCP Units Outstanding 210 Implied DCP Unit Price Range—2024E EBITDA $33.41—$40.93 Implied DCP Unit Price Range—2023E and 2024E EBITDA $33.41—$40.99 1. As of December 31, 2022 48

Preliminary Draft – Confidential Supplemental Valuation Materials – NYMEX Strip Pricing B Peer Group Trading Analysis – Price/DCF per LP Unit ($ in millions, except per unit amounts) 2023E DCF / LP Unit $5.34 Relevant Multiple 6.5x—7.5x Implied DCP Unit Price Range—2023E Price / DCF $34.73—$40.08 2024E DCF / LP Unit $5.55 Relevant Multiple 6.0x—7.0x Implied DCP Unit Price Range—2024E Price / DCF $33.30—$38.85 Implied DCP Unit Price Range—2023E and 2024E Price / DCF $33.30—$40.08 49

Preliminary Draft – Confidential Supplemental Valuation Materials – NYMEX Strip Pricing B Precedent M&A Transaction Analysis – EV/EBITDA ($ in millions, except per unit amounts) 2022E Adjusted EBITDA $1,749 Relevant EBITDA Multiple 7.25x—9.25x Implied Enterprise Value Based on 2022E Adjusted EBITDA $12,682—$16,180 Less: Preferred Equity1 (271) Less: Net Debt1 (5,331) Less: Noncontrolling Interests1 (25) Implied Equity Value $7,055—$10,553 DCP Units Outstanding 210 Implied DCP Unit Price Range—2022E EBITDA $33.56—$50.20 1. As of December 31, 2022 50

Preliminary Draft – Confidential C Sensitivity Case C – Higher Commodity Prices

Preliminary Draft – Confidential DCP Financial Projections – Higher Commodity Prices C DCP Financial Projections ($ in millions) For the Years Ending December 31, 2022E-2027E 2022E 2023E 2024E 2025E 2026E 2027E CAGR Gathering & Processing Segment North Region $1,075 $1,005 $884 $890 $878 $867 (4.2%) South Region 190 162 147 144 143 142 (5.7%) Midcontinent Region 275 254 232 222 221 220 (4.4%) Permian Region 572 612 577 557 555 552 (0.7%) Other G&P -——————- Total Gathering & Processing Gross Margin $2,112 $2,033 $1,839 $1,812 $1,796 $1,780 (3.4%) Total Costs North Region ($157) ($144) ($154) ($154) ($156) ($158) 0.2% South Region (99) (99) (92) (92) (94) (95) (0.8%) Midcontinent Region (165) (162) (174) (174) (177) (179) 1.6% Permian Region (251) (293) (307) (308) (312) (317) 4.7% Other G&P (19) (23) (20) (21) (21) (21) 2.6% Total Gathering & Processing Costs ($691) ($721) ($748) ($748) ($760) ($771) 2.2% Total Gathering & Processing Segment Margin $1,421 $1,312 $1,091 $1,064 $1,037 $1,010 (6.6%) Logistics & Marketing Segment Southern Hills + Sand Hills $429 $436 $442 $449 $449 $449 0.9% Other NGL Pipelines 141 149 156 158 158 158 2.3% NGL Marketing + Storage 46 49 39 39 39 39 (3.2%) Downstream Fractionation 19 21 21 21 21 21 2.0% Gas Marketing + Other Income 18 13 13 13 13 13 (7.1%) Gas Storage 2 13 12 12 12 12 43.2% Guadalupe 62 48 40 40 40 40 (8.5%) Gulf Coast Express Equity Earnings 66 66 66 66 66 66 (0.0%) Cheyenne Connector Equity Earnings 14 14 14 14 14 14 0.0% Total Logistics & Marketing Gross Margin $798 $810 $804 $812 $812 $812 0.4% Total Costs Logistics & Marketing Costs ($44) ($47) ($41) ($41) ($42) ($42) (0.9%) Total Logistics & Marketing Segment Margin $754 $763 $763 $771 $771 $770 0.4% Source: DCP Management 51

Preliminary Draft – Confidential DCP Financial Projections – Higher Commodity Prices C DCP Financial Projections – Summary Cash Flows ($ in millions, except per unit amounts) For the Years Ending December 31, 2022E-2027E 2022E 2023E 2024E 2025E 2026E 2027E CAGR Gathering & Processing Segment Margin $1,421 $1,312 $1,091 $1,064 $1,037 $1,010 (6.6%) Logistics & Marketing Segment Margin 754 763 763 771 771 770 0.4% Less: Corporate Costs (255) (257) (236) (236) (239) (243) (1.0%) Plus: Adj. Distribution in Excess of Equity Earnings—Logistics 77 80 80 80 80 80 0.9% Plus: Adj. Distribution in Excess of Equity Earnings—Discovery 13 9 9 9 9 9 (7.3%) Plus: Hedge settlement (294) (47) (8) (8) -—- Adjusted EBITDA $1,717 $1,860 $1,700 $1,681 $1,657 $1,626 (1.1%) Plus: Growth Projects -—- 18 25 32 39 Total Adjusted EBITDA $1,717 $1,860 $1,718 $1,706 $1,690 $1,666 (0.6%) Less: Interest Expense ($273) ($282) ($256) ($220) ($210) ($183) Less: Preferred Securities (58) (15) -———-Less: Sustaining Capital (135) (150) (150) (125) (125) (125) Less: Income Taxes (5) (5) (5) (5) (5) (5) Less: Other (3) (7) (7) (5) (5) (5) Distributable Cash Flow $1,242 $1,401 $1,300 $1,351 $1,344 $1,347 1.6% Identified Organic Capital ($140) $— $— $— $— $—Unidentified Organic Capital — (125) (50) (50) (50) (50) Acquisition Capital (160) -————- Distributions (342) (359) (359) (359) (359) (359) 1.0% Working Capital and Interest Timing (30) 133 90 -——- Cash Surplus / (Shortfall) $570 $1,050 $981 $942 $935 $938 10.5% LP Units Outstanding 208 209 209 209 209 209 0.0% Distributable Cash Flow per LP Unit $5.96 $6.71 $6.23 $6.47 $6.44 $6.46 1.6% Distribution per Unit 1.68 1.72 1.72 1.72 1.72 1.72 0.5% Total Distributions $342 $359 $359 $359 $359 $359 1.0% Source: DCP Management 52

Preliminary Draft – Confidential DCP Financial Projections – Higher Commodity Prices C DCP Financial Projections – Sources and Uses ($ in millions) For the Years Ending December 31, 2022E 2023E 2024E 2025E 2026E 2027E Sources DCF Surplus / (Shortfall) $570 $1,050 $981 $942 $935 $938 Revolver Draw 279 -————- Total Sources $849 $1,050 $981 $942 $935 $938 Uses Revolver Paydown $— $279 $260 $— $— $— Long-Term Debt Paydown 350 500 — 825 — 500 Preferred Equity Redemption 500 271 -———-Cash Balance Increase / (Decrease) (1) — 720 117 935 438 Total Uses $849 $1,050 $981 $942 $935 $938 Memo: Cash $— $— $720 $837 $1,772 $2,211 Total Debt 5,364 4,585 4,325 3,500 3,500 3,000 Net Debt $5,364 $4,585 $3,605 $2,663 $1,728 $789 Preferred Equity 271 -————- Net Debt + Preferred Equity $5,635 $4,585 $3,605 $2,663 $1,728 $789 Total Debt / Adjusted EBITDA 3.1x 2.5x 2.5x 2.1x 2.1x 1.8x Net Debt / Adjusted EBITDA 3.1 2.5 2.1 1.6 1.0 0.5 (Net Debt + Preferred Equity) / Adjusted EBITDA 3.3 2.5 2.1 1.6 1.0 0.5 Source: DCP Management 53

Preliminary Draft – Confidential Supplemental Valuation Materials – Higher Commodity Prices C Discounted Cash Flow Analysis ($ in millions, except per unit amounts) Summary Results For the Years Ending December 31, Exit Perpetuity 2023E 2024E 2025E 2026E 2027E Multiple Growth Adjusted EBITDA $1,860 $1,718 $1,706 $1,690 $1,666 $1,666 $1,666 Less: Tax Depreciation and Amortization¹ (16,314) (154) (127) (118) (116) (125) EBIT ($14,455) $1,564 $1,579 $1,571 $1,550 $1,541 Less: Cash Taxes — (93) (93) (116) (115) (570) EBIAT ($14,455) $1,472 $1,486 $1,455 $1,435 $971 Plus: Tax Depreciation and Amortization 16,314 154 127 118 116 125 Less: Maintenance Capex (150) (150) (125) (125) (125) (125) Less: Growth Capex (125) (50) (50) (50) (50) —Unlevered Free Cash Flow $1,585 $1,425 $1,438 $1,398 $1,376 $971 EBITDA Multiple / Perpetuity Growth Rate 8.5x 1.0% Implied Terminal Value $14,158 $15,082 Present Value of Terminal Value @ 7.5% Discount Rate $9,862 $10,132 Plus: Present Value of Unlevered Free Cash Flow @ 7.5% Discount Rate 6,087 Implied Enterprise Value $15,948 $16,219 Less: Preferred Equity2 ($271) Less: Net Debt2 (5,364) Less: Noncontrolling Interests2 (25) Implied Equity Value $10,288 $10,559 DCP Units Outstanding3 210 Implied Value per Unit $48.94 $50.22 Sensitivity Analysis Terminal Exit Multiple Perpetuity Growth Rate 7.5x 8.0x 8.5x 9.0x 9.5x —% 0.5% 1.0% 1.5% 2.0% 6.5% $46.03 $48.92 $51.81 $54.70 $57.59 6.5% $52.89 $57.35 $62.62 $68.94 $76.67 C C 7.0% 44.71 47.53 50.35 53.18 56.00 C C 7.0% 47.80 51.54 55.91 61.07 67.26 WA 7.5% 43.42 46.18 48.94 51.70 54.45 WA 7.5% 43.38 46.56 50.22 54.50 59.55 8.0% 42.16 44.86 47.55 50.25 52.95 8.0% 39.52 42.24 45.35 48.93 53.12 8.5% 40.94 43.57 46.21 48.84 51.48 8.5% 36.10 38.45 41.12 44.16 47.68 54 1. 2023E tax DD&A assumes 80% bonus depreciation calculated as the midpoint of the enterprise value range plus 2023E capital expenditures 2. Per DCP Management as of December 31, 2022 3. Includes 117.8mm common units held by DCP Midstream, LLC and DCP Midstream GP, LP, and 1.8mm phantom and performance units

Preliminary Draft – Confidential Supplemental Valuation Materials – Higher Commodity Prices C Peer Group Trading Analysis – EV/EBITDA ($ in millions, except per unit amounts) 2023E Adjusted EBITDA $1,860 Relevant EBITDA Multiple 8.0x—9.0x Implied Enterprise Value Based on 2023E Adjusted EBITDA $14,880—$16,740 Less: Preferred Equity1 (271) Less: Net Debt1 (5,364) Less: Noncontrolling Interests1 (25) Implied Equity Value $9,220—$11,080 DCP Units Outstanding 210 Implied DCP Unit Price Range—2023E EBITDA $43.85—$52.70 2024E Adjusted EBITDA $1,718 Relevant EBITDA Multiple 8.0x—9.0x Implied Enterprise Value Based on 2024E Adjusted EBITDA $13,742—$15,459 Less: Preferred Equity1 (271) Less: Net Debt1 (5,364) Less: Noncontrolling Interests1 (25) Implied Equity Value $8,082—$9,799 DCP Units Outstanding 210 Implied DCP Unit Price Range—2024E EBITDA $38.44—$46.61 Implied DCP Unit Price Range—2023E and 2024E EBITDA $38.44—$52.70 1. As of December 31, 2022 55

Preliminary Draft – Confidential Supplemental Valuation Materials – Higher Commodity Prices C Peer Group Trading Analysis – Price/DCF per LP Unit ($ in millions, except per unit amounts) 2023E DCF / LP Unit $6.71 Relevant Multiple 6.5x—7.5x Implied DCP Unit Price Range—2023E Price / DCF $43.62—$50.33 2024E DCF / LP Unit $6.23 Relevant Multiple 6.0x—7.0x Implied DCP Unit Price Range—2024E Price / DCF $37.36—$43.59 Implied DCP Unit Price Range—2023E and 2024E Price / DCF $37.36—$50.33 56

Preliminary Draft – Confidential Supplemental Valuation Materials – Higher Commodity Prices C Precedent M&A Transaction Analysis – EV/EBITDA ($ in millions, except per unit amounts) 2022E Adjusted EBITDA $1,717 Relevant EBITDA Multiple 7.25x—9.25x Implied Enterprise Value Based on 2022E Adjusted EBITDA $12,446—$15,879 Less: Preferred Equity1 (271) Less: Net Debt1 (5,364) Less: Noncontrolling Interests1 (25) Implied Equity Value $6,785—$10,219 DCP Units Outstanding 210 Implied DCP Unit Price Range—2022E EBITDA $32.28—$48.61 1. As of December 31, 2022 57

Preliminary Draft – Confidential D Sensitivity Case D – Lower Commodity Prices

Preliminary Draft – Confidential DCP Financial Projections – Lower Commodity Prices D DCP Financial Projections ($ in millions) For the Years Ending December 31, 2022E-2027E 2022E 2023E 2024E 2025E 2026E 2027E CAGR Gathering & Processing Segment North Region $1,075 $478 $397 $414 $414 $414 (17.4%) South Region 190 127 115 113 113 113 (9.9%) Midcontinent Region 275 222 209 201 201 201 (6.1%) Permian Region 572 487 487 469 469 469 (3.9%) Other G&P -——————- Total Gathering & Processing Gross Margin $2,112 $1,314 $1,208 $1,197 $1,197 $1,197 (10.7%) Total Costs North Region ($157) ($144) ($154) ($154) ($156) ($158) 0.2% South Region (99) (99) (92) (92) (94) (95) (0.8%) Midcontinent Region (165) (162) (174) (174) (177) (179) 1.6% Permian Region (251) (293) (307) (308) (312) (317) 4.7% Other G&P (19) (23) (20) (21) (21) (21) 2.6% Total Gathering & Processing Costs ($691) ($721) ($748) ($748) ($760) ($771) 2.2% Total Gathering & Processing Segment Margin $1,421 $593 $460 $449 $437 $426 (21.4%) Logistics & Marketing Segment Southern Hills + Sand Hills $429 $436 $442 $449 $449 $449 0.9% Other NGL Pipelines 141 149 156 158 158 158 2.3% NGL Marketing + Storage 46 49 39 39 39 39 (3.2%) Downstream Fractionation 19 21 21 21 21 21 2.0% Gas Marketing + Other Income 18 13 13 13 13 13 (7.1%) Gas Storage 2 13 12 12 12 12 43.2% Guadalupe 62 48 40 40 40 40 (8.5%) Gulf Coast Express Equity Earnings 66 66 66 66 66 66 (0.0%) Cheyenne Connector Equity Earnings 14 14 14 14 14 14 0.0% Total Logistics & Marketing Gross Margin $798 $810 $804 $812 $812 $812 0.4% Total Costs Logistics & Marketing Costs ($44) ($47) ($41) ($41) ($42) ($42) (0.9%) Total Logistics & Marketing Segment Margin $754 $763 $763 $771 $771 $770 0.4% Source: DCP Management 58

Preliminary Draft – Confidential DCP Financial Projections – Lower Commodity Prices D DCP Financial Projections – Summary Cash Flows ($ in millions, except per unit amounts) For the Years Ending December 31, 2022E-2027E 2022E 2023E 2024E 2025E 2026E 2027E CAGR Gathering & Processing Segment Margin $1,421 $593 $460 $449 $437 $426 (21.4%) Logistics & Marketing Segment Margin 754 763 763 771 771 770 0.4% Less: Corporate Costs (255) (257) (236) (236) (239) (243) (1.0%) Plus: Adj. Distribution in Excess of Equity Earnings—Logistics 77 80 80 80 80 80 0.9% Plus: Adj. Distribution in Excess of Equity Earnings—Discovery 13 9 9 9 9 9 (7.3%) Plus: Hedge settlement (294) 112 42 13 -—- Adjusted EBITDA $1,717 $1,300 $1,118 $1,087 $1,058 $1,043 (9.5%) Plus: Growth Projects -—- 18 25 32 39 Total Adjusted EBITDA $1,717 $1,300 $1,136 $1,112 $1,090 $1,082 (8.8%) Less: Interest Expense ($273) ($302) ($286) ($262) ($247) ($229) Less: Preferred Securities (58) (15) -———-Less: Sustaining Capital (135) (150) (150) (125) (125) (125) Less: Income Taxes (5) (5) (5) (5) (5) (5) Less: Other (3) (7) (7) (5) (5) (5) Distributable Cash Flow $1,242 $822 $688 $715 $708 $718 (10.4%) Identified Organic Capital ($140) $— $— $— $— $—Unidentified Organic Capital — (125) (50) (50) (50) (50) Acquisition Capital (160) -————- Distributions (342) (359) (359) (359) (359) (359) 1.0% Working Capital and Interest Timing (30) 133 90 -——- Cash Surplus / (Shortfall) $570 $471 $369 $306 $299 $309 (11.5%) LP Units Outstanding 208 209 209 209 209 209 0.0% Distributable Cash Flow per LP Unit $5.96 $3.94 $3.30 $3.43 $3.39 $3.44 (10.4%) Distribution per Unit 1.68 1.72 1.72 1.72 1.72 1.72 0.5% Total Distributions $342 $359 $359 $359 $359 $359 1.0% Source: DCP Management 59

Preliminary Draft – Confidential DCP Financial Projections – Lower Commodity Prices D DCP Financial Projections – Sources and Uses ($ in millions) For the Years Ending December 31, 2022E 2023E 2024E 2025E 2026E 2027E Sources DCF Surplus / (Shortfall) $570 $471 $369 $306 $299 $309 Revolver Draw 279 300 — 519 — 191 Total Sources $849 $771 $369 $825 $299 $500 Uses Revolver Paydown $— $— $369 $— $299 $— Long-Term Debt Paydown 350 500 — 825 — 500 Preferred Equity Redemption 500 271 -———-Cash Balance Increase / (Decrease) (1) -————- Total Uses $849 $771 $369 $825 $299 $500 Memo: Cash $— $— $— $— $— $— Total Debt 5,364 5,164 4,795 4,489 4,190 3,881 Net Debt $5,364 $5,164 $4,795 $4,489 $4,190 $3,881 Preferred Equity 271 -————- Net Debt + Preferred Equity $5,635 $5,164 $4,795 $4,489 $4,190 $3,881 Total Debt / Adjusted EBITDA 3.1x 4.0x 4.2x 4.0x 3.8x 3.6x Net Debt / Adjusted EBITDA 3.1 4.0 4.2 4.0 3.8 3.6 (Net Debt + Preferred Equity) / Adjusted EBITDA 3.3 4.0 4.2 4.0 3.8 3.6 Source: DCP Management 60

Preliminary Draft – Confidential Supplemental Valuation Materials – Lower Commodity Prices D Discounted Cash Flow Analysis ($ in millions, except per unit amounts) Summary Results For the Years Ending December 31, Exit Perpetuity 2023E 2024E 2025E 2026E 2027E Multiple Growth Adjusted EBITDA $1,300 $1,136 $1,112 $1,090 $1,082 $1,082 $1,082 Less: Tax Depreciation and Amortization¹ (10,350) (154) (127) (118) (116) (125) EBIT ($9,050) $983 $984 $972 $967 $957 Less: Cash Taxes — (58) (58) (72) (72) (354) EBIAT ($9,050) $924 $926 $900 $895 $603 Plus: Tax Depreciation and Amortization 10,350 154 127 118 116 125 Less: Maintenance Capex (150) (150) (125) (125) (125) (125) Less: Growth Capex (125) (50) (50) (50) (50) —Unlevered Free Cash Flow $1,025 $878 $878 $843 $836 $603 EBITDA Multiple / Perpetuity Growth Rate 8.5x 1.0% Implied Terminal Value $9,199 $9,370 Present Value of Terminal Value @ 7.5% Discount Rate $6,407 $6,295 Plus: Present Value of Unlevered Free Cash Flow @ 7.5% Discount Rate 3,768 Implied Enterprise Value $10,175 $10,063 Less: Preferred Equity2 ($271) Less: Net Debt2 (5,364) Less: Noncontrolling Interests2 (25) Implied Equity Value $4,515 $4,403 DCP Units Outstanding3 210 Implied Value per Unit $21.48 $20.94 Sensitivity Analysis Terminal Exit Multiple Perpetuity Growth Rate 7.5x 8.0x 8.5x 9.0x 9.5x —% 0.5% 1.0% 1.5% 2.0% 6.5% $19.56 $21.44 $23.32 $25.20 $27.08 6.5% $22.59 $25.36 $28.64 $32.57 $37.37 C C 7.0% 18.72 20.55 22.39 24.22 26.06 C C 7.0% 19.43 21.76 24.47 27.68 31.52 WA 7.5% 17.89 19.68 21.48 23.27 25.06 WA 7.5% 16.69 18.67 20.94 23.60 26.74 8.0% 17.09 18.84 20.59 22.34 24.09 8.0% 14.29 15.98 17.92 20.15 22.75 8.5% 16.30 18.02 19.73 21.44 23.15 8.5% 12.17 13.64 15.29 17.18 19.37 61 1. 2023E tax DD&A assumes 80% bonus depreciation calculated as the midpoint of the enterprise value range plus 2023E capital expenditures 2. Per DCP Management as of December 31, 2022 3. Includes 117.8mm common units held by DCP Midstream, LLC and DCP Midstream GP, LP, and 1.8mm phantom and performance units

Preliminary Draft – Confidential Supplemental Valuation Materials – Lower Commodity Prices D Peer Group Trading Analysis – EV/EBITDA ($ in millions, except per unit amounts) 2023E Adjusted EBITDA $1,300 Relevant EBITDA Multiple 8.0x—9.0x Implied Enterprise Value Based on 2023E Adjusted EBITDA $10,404—$11,704 Less: Preferred Equity1 (271) Less: Net Debt1 (5,364) Less: Noncontrolling Interests1 (25) Implied Equity Value $4,744—$6,044 DCP Units Outstanding 210 Implied DCP Unit Price Range—2023E EBITDA $22.56—$28.75 2024E Adjusted EBITDA $1,136 Relevant EBITDA Multiple 8.0x—9.0x Implied Enterprise Value Based on 2024E Adjusted EBITDA $9,090—$10,226 Less: Preferred Equity1 (271) Less: Net Debt1 (5,364) Less: Noncontrolling Interests1 (25) Implied Equity Value $3,430—$4,566 DCP Units Outstanding 210 Implied DCP Unit Price Range—2024E EBITDA $16.31—$21.72 Implied DCP Unit Price Range—2023E and 2024E EBITDA $16.31—$28.75 1. As of December 31, 2022 62

Preliminary Draft – Confidential Supplemental Valuation Materials – Lower Commodity Prices D Peer Group Trading Analysis – Price/DCF per LP Unit ($ in millions, except per unit amounts) 2023E DCF / LP Unit $3.94 Relevant Multiple 6.5x—7.5x Implied DCP Unit Price Range—2023E Price / DCF $25.59—$29.52 2024E DCF / LP Unit $3.30 Relevant Multiple 6.0x—7.0x Implied DCP Unit Price Range—2024E Price / DCF $19.79—$23.09 Implied DCP Unit Price Range—2023E and 2024E Price / DCF $19.79—$29.52 63

Preliminary Draft – Confidential Supplemental Valuation Materials – Lower Commodity Prices D Precedent M&A Transaction Analysis – EV/EBITDA ($ in millions, except per unit amounts) 2022E Adjusted EBITDA $1,717 Relevant EBITDA Multiple 7.25x—9.25x Implied Enterprise Value Based on 2022E Adjusted EBITDA $12,446—$15,879 Less: Preferred Equity1 (271) Less: Net Debt1 (5,364) Less: Noncontrolling Interests1 (25) Implied Equity Value $6,785—$10,219 DCP Units Outstanding 210 Implied DCP Unit Price Range—2022E EBITDA $32.28—$48.61 1. As of December 31, 2022 64

Preliminary Draft – Confidential C. LPG Market Overview

Preliminary Draft – Confidential LPG Market Overview Overview Gulf Coast LPG Export Market â—¼ Global Demand: Significant and persistent global demand Permian Basin NGL Pipelines to Gulf Coast Market for LPGs is primarily driven by Asian markets, which lack both local petroleum feedstock and local refining and/or 3,700 processing infrastructure 3,200 â—¼ U.S. Surplus: Rapid growth in U.S. domestic oil and gas 2,700 production has resulted in LPGs exceeding domestic MBpd demand with domestic demand for LPGs remaining relatively 2,200 flat over the past two decades and projected to remain 1,700 relatively flat over the near-to-medium term 1,200 â—¼ Gulf Coast Infrastructure: Several major expansions of Q4 Q1 Q2 Q3 Q4 Q1 Q2 Q3 Q4 Q1 Q2 Q3 Q4 Q1 Q2 Q3 Q4 LPG export capacity are underway to accommodate the 2018 2019 2020 2021 2022E anticipated long-term eastward flows of global LPG trade Existing Capacity Sand Hills Shin Oak â—¼ Fungibility: DCP delivers significant NGL volumes primarily Grand Prix West TX LPG EPIC NGL Lone Star NGL Express to Mont Belvieu, the primary hub for both domestic and exported LPGs U.S. Domestic LPG Supply and Demand Balance 4.00 3.58 — 3.58 3.64 — 3.64 3.41 (0.03) 3.38 0.63 0.63 3.00 0.62 (MMBpd) 1.79 1.78 1.79 e 2.00 n c ala 2.79 2.96 3.01 b 1.00 1.85 LPG 1.59 1.80 US —Production Stocks Demand Production Stocks Demand Production Stocks Demand 2022E 2023E 2024E Gas plant Refinery Exports Domestic demand Source: Wall Street Research 65

Preliminary Draft – Confidential LPG Market Overview Texas Fractionation Overview Texas NGL Fractionation Capacity 5,500 5,000 4,500 MBpd 4,000 3,500 ` 3,000 Q1 Q2 Q3 Q4 Q1 Q2 Q3 Q4 Q1 Q2 Q3 Q4 Q1 Q2 Q3 Q4 Q1 Q2 Q3 Q4 2019 2020 2021 2022E 2023E Existing Capacity Energy Transfer ONEOK Enterprise Targa EPIC Philips 66 U.S. Gulf Coast Capacity Additions 350 300 300 250 200 150 125 150 150 150 125 150 150 110 110 110 110 Bp d 100 M 50 —Energy Targa Frac 6 ONEOK Frac4 Enterprise Energy Targa Frac 7 Enterprise Targa Frac 8 ONEOK Frac5 EPIC Frac 1 Phillips 66 Phillips 66 Transfer Frac Frac 10 Transfer Frac Frac 11 Frac 2&3 6 7 Q1 Q2 Q1 Q3 Q3 Q3 Q3 Q4 2019 2019 2020 2023E 2020 2020 2022E Mont Belvieu Corpus Christi Sweeny Source: Wall Street Research 66

Preliminary Draft – Confidential LPG Market Overview U.S. LPG Oceangoing LPG Exports Historical U.S. Propane Export Total (MBpd) 1,500 d ) (MBp 1,250 rt 1,000 Exp o 750 ane Pro p 500 . S 250 U . — 2007A 2008A 2009A 2010A 2011A 2012A 2013A 2014A 2015A 2016A 2017A 2018A 2019A 2020A 2021A 2022A AFR ASI AUS CAN CAR EUR LAT Historical U.S. Ethane Export Total (MBpd) 500 (MBpd) 400 Export 300 Ethane 200 . S 100 U . — 2007A 2008A 2009A 2010A 2011A 2012A 2013A 2014A 2015A 2016A 2017A 2018A 2019A 2020A 2021A 2022A AFR ASI AUS CAN CAR EUR LAT Source: RBN Energy 67

Preliminary Draft – Confidential LPG Market Overview LPG Production Growth and Capacity Utilization Terminal Capacity Utilization vs. YoY LPG Production Growth Actual Seaborne Exports 7.0% 3.0 120% 6.1% 6.0% 2.5 100% r ce o u 5.3% S 5.1% by Growth 5.0% 4.7% uction 2.0 80% ro d 4.0% P P G Utiliza L MMBpd tion US 1.5 60% OY (%) Y 3.0% 107% 2.4% 2.0% 1.0 40% 1.9% 2.0% 1.8% 1.7% 70% 64% 58% 58% 66% 68% 61% 57% 64% 0.5 20% 1.0% 0.4% 0.2% 0.1% —% -—-% 2022E 2023E 2024E 2025E LPG Production Gas Plants Refinery Utilization Estimate Capacity (MMBpd) Marine Exports (MMBpd) Source: Wall Street Research 68

Preliminary Draft – Confidential LPG Market Overview LPG Export Supply Growth Primary Sources Middle East LPG Exports (m tonnes) U.S. LPG Exports (m tonnes) 2 60 8 49 1 1 48 1 3 43 2021A 2022E 2023E 2024E 2024E 2021A 2022E 2023E 2024E 2024E Source: Wall Street Research 69

Preliminary Draft – Confidential LPG Market Overview Historical Pricing of NGLs/LPGs vs. Crude Oil Historical Commodity Prices $1.60 $140.00 Domestic Market $1.40 $120.00 $1.20 2018A 2019A 2020A 2021A 2022A $100.00 Ethane $0.32 $0.22 $0.19 $0.31 $0.48 /Gal) $1.00 W $ $80.00 I T Propane $0.87 $0.54 $0.47 $1.04 $1.11 ( ( s $0.80 $ Iso-Butane $1.02 $0.71 $0.59 $1.17 $1.39 NGL $0.60 $60.00 /Bbl ) Normal-Butane $1.01 $0.65 $0.57 $1.18 $1.32 $40.00 Natural Gasoline $1.44 $1.14 $0.78 $1.54 $1.92 $0.40 $20.00 NGLs (Composite) $0.74 $0.51 $0.41 $0.83 $1.00 $0.20 Crude Oil (WTI) $64.94 $56.97 $39.37 $68.07 $94.93 $— $--Jan-18 Jan-19 Jan-20 Jan-21 Jan-22 Dec-22 Ethane Propane NGLs (Composite) Crude Oil (WTI) Historical Commodity Prices (% of WTI) 100% $140.00 Domestic Market 80% $120.00 $100.00 2018A 2019A 2020A 2021A 2022A Ethane 20.8% 16.0% 20.2% 19.0% 21.2% I T 60% $80.00 WTI Propane 56.5% 40.1% 50.1% 64.5% 49.2% W ( $ of $60.00 Iso-Butane 65.7% 52.2% 62.9% 72.5% 61.6% % 40% /Bbl ) Normal-Butane 65.6% 47.9% 61.0% 72.8% 58.2% $40.00 Natural Gasoline 92.8% 84.2% 83.7% 95.3% 85.0% 20% $20.00 NGLs (Composite) 48.0% 37.8% 44.1% 51.0% 44.2% —% $--Jan-18 Jan-19 Jan-20 Jan-21 Jan-22 Dec-22 Ethane Propane NGLs (Composite) Crude Oil (WTI) Source: FactSet as of January 3, 2023 70

$ 0 $ 1 $ 1 0 $ 0 $ 1 $ . . . . . . Source: — $ 50 00 50 — $ 40 80 20 NGL DCP LPG 2021A $1.17 2021A $0.83 NGL and Historical Historical Management, 2022A $1.39—Iso 2022A $1.00 LPG Market NYMEX 2023E $1.03 2023E $0.71 Composite Butane Strip ( as 2024E $0.97 $ 2024E $0.68 of Pricing: NYMEX NYMEX Barrel 2025E $0.89 /Gal)( January 2025E $0.65 $ Strip Strip 3, Overview 2023 Pricing 2026E $0.89 Pricing 2026E $0.65 /Gal) 2027E $0.89 2027E $0.65 Historicals $ $ $ $ $ $ . vs 0 1 1 0 0 0 . . . . . . $ — 50 00 50 — $ 20 40 60 2021A $1.18 2021A $0.31 NYMEX Historical Historical 2022A $1.32 Normal 2022A $0.48 —Strip 2023E $1.00 2023E $0.26 Ethane 71 ( 2024E $0.24 $ 2024E $0.95 Butane NYMEX $ ( NYMEX /Gal) 2025E $0.24 Strip 2025E $0.90 /Gal) Strip Pricing 2026E $0.85 Pricing 2026E $0.26 2027E $0.85 2027E $0.26 $ 0 $ 1 2 $ $ 0 1 $ 1 $ . . . . . . $ — 75 50 25 $ — 50 00 50 Historical 2021A $1.54 Historical 2021A $1.04 2022A $1.92 Natural 2022A $1.11 2023E $1.49 2023E $0.81 Propane ( Preliminary $ 2024E $1.42 Gasoline 2024E $0.81 $ ( Draft NYMEX NYMEX /Gal) –Strip 2025E $1.37 /Gal) Strip 2025E $0.78 Pricing 2026E $1.37 Pricing 2026E $0.76 Confidential 2027E $1.37 2027E $0.76

Preliminary Draft – Confidential LPG Market Overview NGL Consensus Pricing Commentary “Lowering NGL Price Estimates… The decrease is tied to (1) lower plastics demand due to the global economic slowdown, (2) lower global demand for US LPGs (in the near term) and higher projected propane inventory levels, and (3) higher projected NGL supply growth.” “The deterioration in global economic growth is beginning to take a toll on US NGL fundamentals. Processing margins have narrowed (ethane frac spread is negative), ethane rejection is rising and could reduce volumes on NGL pipelines/fracs, and LPG export volumes are declining from record levels in Q2.” Michael Blum, Wells Fargo (October 21, 2022) “3Q22 ethane prices of 55c/gal could fall to ~40c/gal in 4Q22/1Q23, with another step-down to 33c/gal in 2Q23+ as Henry Hub/Waha prices slide to $4.94/$2.18 per Mcf in 2Q23…ethane is typically 35-45% of the composite NGL barrel, causing its pricing to have an outsized impact on NGL prices vs. other purity products.” Chase Mulvehill, BofA Securities (October 9, 2022) “Given the significant increase in oil and gas prices driven by a host of factors including: a strong rebound in oil demand as the world emerges from COVID, continued supply-chain issues which are driving inflation, a tight global LNG market, and the Russia/Ukraine conflict, we are materially increasing our NGL price estimates. We’re raising our 2022 and 2023 NGL price estimates to $1.18/g and $1.06/g, respectively, from $0.92/g and $0.82/g. The increase to our NGL price deck reflects higher near-term crude oil and natural gas price estimates from our E&P and refining teams, partially offset by lower assumed LPG-to-Brent ratios.” Michael Blum, Wells Fargo (March 23, 2022) “The NGL-to-WTI and NGL-to-Brent crude oil ratios averaged 52% and 51%, respectively, in February, both of which are below the prior month. NGL prices to a large extent track Brent more closely than WTI, given that a significant portion of overall demand for NGLs is predicated on exports and competition in the global markets (e.g., ethylene derivative and LPG exports).” Praneeth Satish, Wells Fargo (March 23, 2022) Source: Wall Street Research 72
Exhibit (c)(14)

Exhibit (c)(14) Discussion Materials Prepared for the Special Committee of the Board of Directors of DCP Midstream GP, LLC January 5, 2023 [Graphic Appears Here] [Graphic Appears Here]

These materials have been prepared by Evercore Group L.L.C. (“Evercore”) for the Special Committee (the “Special Committee”) of the Board of Directors of DCP Midstream GP, LLC, the general partner of the general partner of DCP Midstream, LP (“DCP” or the “Partnership”), to whom such materials are directly addressed and delivered and may not be used or relied upon for any purpose other than as specifically contemplated. These materials are based on information provided by or on behalf of the Partnership and/or other potential transaction participants, from public sources or otherwise reviewed by Evercore. Evercore assumes no responsibility for independent investigation or verification of such information and has relied on such information being complete and accurate in all material respects. To the extent such information includes estimates and forecasts of future financial performance prepared by or reviewed with the management of the Partnership and/or other potential transaction participants or obtained from public sources, Evercore has assumed that such estimates and forecasts have been reasonably prepared on bases reflecting the best currently available estimates and judgments of such management (or, with respect to estimates and forecasts obtained from public sources, represent reasonable estimates). No representation or warranty, express or implied, is made as to the accuracy or completeness of such information and nothing contained herein is, or shall be relied upon as, a representation, whether as to the past, the present or the future. These materials were designed for use by specific persons familiar with the business and affairs of the Partnership. These materials are not intended to provide the sole basis for evaluating, and should not be considered a recommendation with respect to, any transaction or other matter. These materials have been developed by and are proprietary to Evercore and were prepared exclusively for the benefit and internal use of the Special Committee. These materials were compiled on a confidential basis for use of the Special Committee in evaluating the potential transaction described herein and not with a view to public disclosure or filing thereof under state or federal securities laws, and may not be reproduced, disseminated, quoted or referred to, in whole or in part, without the prior written consent of Evercore. These materials do not constitute an offer or solicitation to sell or purchase any securities and are not a commitment by Evercore (or any affiliate) to provide or arrange any financing for any transaction or to purchase any security in connection therewith. Evercore assumes no obligation to update or otherwise revise these materials. These materials may not reflect information known to other professionals in other business areas of Evercore and its affiliates. Evercore and its affiliates do not provide legal, accounting or tax advice. Accordingly, any statements contained herein as to tax matters were neither written nor intended by Evercore or its affiliates to be used and cannot be used by any taxpayer for the purpose of avoiding tax penalties that may be imposed on such taxpayer. Each person should seek legal, accounting and tax advice based on his, her or its particular circumstances from independent advisors regarding the impact of the transactions or matters described herein.

Table of Contents Section Executive Summary I DCP Situation Analysis II DCP Financial Projections III Preliminary Valuation of the Common Units IV Appendix A. Weighted Average Cost of Capital Analysis B. Supplemental Valuation Materials C. LPG Market Overview

I. Executive Summary

Executive Summary Introduction and Overview of Materials â—¼ Evercore Group L.L.C. (“Evercore”) is pleased to provide the following materials to the Special Committee (the “Special Committee”) of the Board of Directors of DCP Midstream GP, LLC (“DCP GP LLC”), the general partner of DCP Midstream GP, LP (the “General Partner”), which is the general partner of DCP Midstream, LP (“DCP” or the “Partnership”), regarding the proposed acquisition by Phillips 66 and its affiliates (collectively, “PSX,” “Phillips 66” or the “Parent”) of all of the outstanding common units (the “Common Units”) of the Partnership not already owned by Phillips 66, Enbridge, Inc. (“ENB”) and their affiliates (the “Public Common Units” and the holders of such Public Common Units, the “Partnership Unaffiliated Unitholders”) for cash (the “Merger”) ï,„ Pursuant to an agreement and plan of merger by and among the Partnership, DCP GP LLC, the General Partner, the Parent, Phillips 66 Project Development Inc., a wholly-owned subsidiary of the Parent (“PDI”), and Dynamo Merger Sub LLC, a wholly-owned subsidiary of PDI (“Merger Sub”) (the “Merger Agreement”), Merger Sub shall merge with and into the Partnership and each Common Unit owned by a Partnership Unaffiliated Unitholder shall be converted into the right to receive $41.75 in cash (the “Merger Consideration”) • Implies a 20.1% premium to PSX’s offer of $34.75 per Public Common Unit (the “Original Offer”) made as of August 17, 2022 (the “Unaffected Date”) • Represents a 21.2% premium to the 10-day1 VWAP of the Common Units as of the Unaffected Date • Represents a 28.5% premium to the 30-day1 VWAP of the Common Units as of the Unaffected Date • PSX currently owns 43.3% of the Common Units2 A â—¼ The Evercore analysis reviews valuation of the Common Units based on the financial projections for DCP as provided by DCP management (the “DCP Financial Projections” or the “Forecast”) as well as sensitivities based on certain price decks including:ï,„ B A sensitivity case utilizing NYMEX Strip Pricing as of January 3, 2023 (“Sensitivity Case B – NYMEX Strip Pricing Case”)ï,„ A sensitivity case based on assumed pricing higher than that utilized in the DCP Financial Projections (“Sensitivity Case C – C Higher Commodity Prices”) ï,„ A sensitivity case based on assumed pricing lower than that utilized in the DCP Financial Projections (“Sensitivity Case D – D Lower Commodity Prices”) Source: DCP Management, FactSet 1. Trading days 2. As of January 4, 2023

Executive Summary Overview of the Transaction Counterparty â—¼ Phillips 66 (NYSE: PSX) â—¼ PSX to acquire 100% of the Public Common Units owned by the Partnership Unaffiliated Unitholders Transaction â—¼ DCP’s Common Units will cease to be publicly traded Summary â–º DCP’s preferred units will continue to be publicly traded Merger â—¼ $41.75 in cash per Public Common Unit Consideration â—¼ Approval of the Special Committee and the Board of Directors of DCP Midstream GP, LLC, the Approvals general partner of the general partner of DCP â—¼ The Merger is a taxable transaction for the Partnership Unaffiliated Unitholders resulting in the Other realization of taxes on deferred income and capital gains

Executive Summary Evercore Evaluation Process Evercore has been asked by the Special Committee, whether, in Evercore’s opinion, as of the date hereof, Opinion and based upon and subject to the assumptions, qualifications, limitations and other matters set forth Requested: therein, the Merger Consideration to be received in the Merger is fair, from a financial point of view, to the Partnership and the Partnership Unaffiliated Unitholders â—¼ In connection with rendering an opinion, Evercore has, among other things: ï,„ reviewed certain publicly available historical operating and financial information relating to the Partnership that we deemed relevant, including as set forth in the Partnership’s Annual Report on Form 10-K for the year ended December 31, 2021, the Partnership’s Quarterly Report on Form 10-Q for the quarter ended September 30, 2022, and certain of the Partnership’s Current Reports on Form 8-K, in each case as filed with or furnished to the Securities and Exchange Commission;ï,„ reviewed certain publicly available business and financial information relating to the Partnership that we deemed to be relevant, including publicly available research analysts’ estimates; ï,„ reviewed certain internal projected financial data relating to the Partnership prepared and furnished to us by management of the Partnership, as approved for our use by the Partnership (the “Forecast”); ï,„ reviewed certain published information regarding commodity prices; ï,„ discussed with management of the Partnership its assessment of the past and current operations of the Partnership, the current financial condition and prospects of the Partnership, and the Forecast;ï,„ reviewed the reported prices and the historical trading activity of the Common Units;ï,„ performed discounted cash flow analyses for the Partnership based on the Forecast and other data provided by management of the Partnership;ï,„ performed discounted distributions analyses based on projected financial data and other data provided by management of the Partnership;ï,„ compared the financial performance of the Partnership and its stock market trading multiples with those of certain other publicly-traded companies and partnerships that we deemed relevant;ï,„ compared the financial performance of the Partnership and the valuation multiples relating to the Merger with the financial terms, to the extent publicly available, of certain other historical transactions that we deemed relevant; ï,„ reviewed the financial terms and conditions of a draft Merger Agreement dated January 4, 2023; andï,„ performed such other analyses and examinations and considered such other factors that we deemed appropriate.

Executive Summary Summary Organizational Structure and Transaction Economics Current Ownership Structure (As-Converted) Economic Interests 43.3% DCP Midstream, LP Economic Interests 13.2% DCP Midstream, LP DCP Midstream, LLC (Merged JV) Phillips 66 oversees and manages DCP 100.0% GP, 56.5% LP DCP Midstream, LP (NYSE:DCP) Common Market Capitalization1,2: $8,066 Preferred Equity: $761 Net Debt: $4,730 Enterprise Value: $13,582 At $41.75, 91mm Public Public Unitholders Common 90,634,032 Common Units Units equates to 43.5% Public Interest a value of $3,784mm ($ in millions, except per unit amounts) Transaction Economics Merger Consideration $41.75 Common Units Outstanding1,2 (mm) 210 Total Equity Value $8,777 Plus: Preferred Equity @ 12/31/22 271 Plus: DCP Net Debt @ 12/31/22 5,331 Plus: Noncontrolling Interests 25 Total Implied Enterprise Value $14,404 Implied Premium To: Premium Unaffected Date (8/17/22) $34.75 20.1% 10-Day VWAP3 34.46 21.2% 20-Day VWAP3 33.88 23.2% 30-Day VWAP3 32.49 28.5% Implied EV/EBITDA (DCP Financial Projections) Metric Multiple 2022E $1,749 8.2x 2023E 1,698 8.5 Implied EV/EBITDA (Wall Street Consensus Estimates) 2022E $1,776 8.1x 2023E 1,750 8.2 Interests to be acquired in the Merger Source: DCP Management, FactSet, Wall St Research; Sources and Uses assumes 12/31 balance sheet date per management model 1. As of January 4, 2023; Includes 117.8mm common units held by DCP Midstream, LLC and DCP Midstream GP, LP | 2. Includes 1.8mm phantom and performance units 3. Based on August 17, 2022 unaffected price date; based on trading days
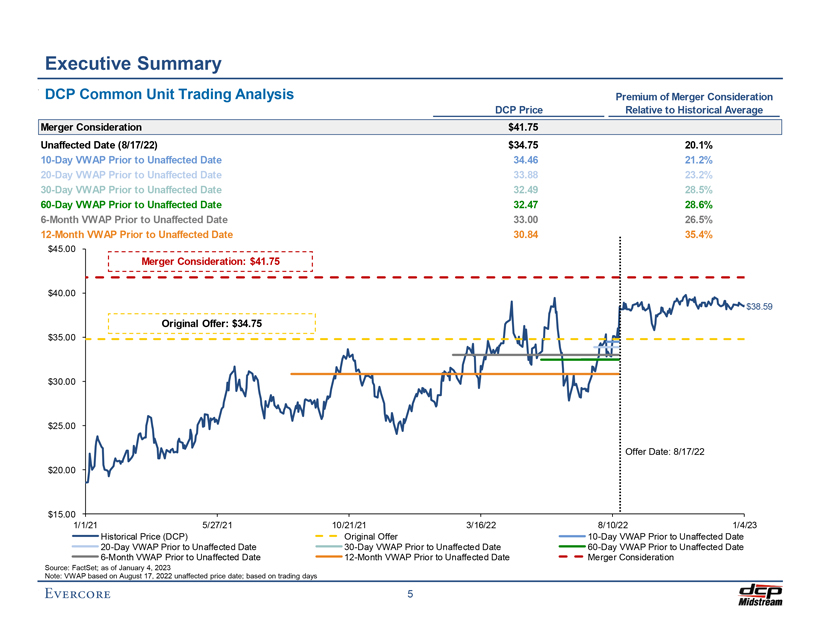
Executive Summary DCP Common Unit Trading Analysis Premium of Merger Consideration DCP Price Relative to Historical Average Merger Consideration $41.75 Unaffected Date (8/17/22) $34.75 20.1% 10-Day VWAP Prior to Unaffected Date 34.46 21.2% 20-Day VWAP Prior to Unaffected Date 33.88 23.2% 30-Day VWAP Prior to Unaffected Date 32.49 28.5% 60-Day VWAP Prior to Unaffected Date 32.47 28.6% 6-Month VWAP Prior to Unaffected Date 33.00 26.5% 12-Month VWAP Prior to Unaffected Date 30.84 35.4% [Graphic Appears Here] Historical Price (DCP) Original Offer 10-Day VWAP Prior to Unaffected Date 20-Day VWAP Prior to Unaffected Date 30-Day VWAP Prior to Unaffected Date 60-Day VWAP Prior to Unaffected Date 6-Month VWAP Prior to Unaffected Date 12-Month VWAP Prior to Unaffected Date Merger Consideration Source: FactSet; as of January 4, 2023 Note: VWAP based on August 17, 2022 unaffected price date; based on trading days

Executive Summary Side-by-Side Analysis ($ in millions, except per unit / share amounts) DCP Total Units Outstanding1 209 Common Unit Price $38.59 Total Equity Value $8,066 Plus: Preferred Equity 761 Plus: Net Debt 4,730 Plus: Noncontrolling Interest 25 Enterprise Value $13,582 DCP Financial Projections Consensus Data Metric Yield/Multiple Metric Yield/Multiple EV/EBITDA 2022E $1,749 7.8x $1,776 7.6x 2023E 1,698 8.0 1,750 7.8 2024E 1,578 8.6 1,665 8.2 P / DCF per LP Unit 2022E $6.12 6.3x $6.26 6.2x 2023E 5.92 6.5 6.15 6.3 2024E 5.55 7.0 5.81 6.6 Distribution Yield Current $1.72 4.5% $1.72 4.5% 2023E 1.72 4.5% 1.81 4.7% 2024E 1.72 4.5% 1.91 4.9% Distribution Coverage 2022E $6.12 3.7x $6.26 3.7x 2023E 5.92 3.4 6.15 3.4 2024E 5.55 3.2 5.81 3.0 PSX Fully-Diluted Shares Outstanding 476 Common Share Price $100.68 Total Equity Value $47,936 Plus: Net Debt 13,913 Plus: Noncontrolling Interest 5,076 Enterprise Value $66,925 Consensus Data Metric Yield/Multiple EV/EBITDA 2022E $15,612 4.3x 2023E 11,075 6.0 2024E 9,536 7.0 P / FCFPS 2022E $15.45 6.5x 2023E 12.85 7.8 2024E 10.74 9.4 Dividend Yield Current $3.88 3.9% 2023E 3.98 3.9% 2024E 4.15 4.1% Note: As of January 4, 2023; Balance sheet data per Partnership / Company filings as of September 30, 2022 Source: FactSet, company filings, DCP Management 1. Includes 117.8mm common units held by DCP Midstream, LLC and DCP Midstream GP, LP, and 0.6mm phantom and performance units

Executive Summary Preliminary Valuation Summary Discounted Peer Group Discounted Cash Flow Analysis Distributions Trading Analysis MLP Analyst Analysis Precedent M&A Premiums Price Transaction Analysis Paid Targets Market Price/DCF Exit Multiple Perpetuity Grow th CAPM EV/EBITDA Return per LP Unit $65.00 $61.07 Implied range based on 5% $55.00 annual $53.18 $52.70 $52.17 distribution growth $50.33 $50.20 $50.20 $49.58 $48.61 $48.61 through $45.40 2027E1 $45.91 $44.37 $45.00 $45.00 $43.31 $44.05 $44.86 $41.61 $40.99 $40.08 $42.24 $38.33 $37.83 $38.44 $39.96 $38.00 $35.00 $34.93 $37.36 $36.05 $35.15 $32.22 $33.35 $33.44 $33.27 $33.41 $33.27 $33.30 $29.52 $33.56 $33.56 $28.75 $32.28 $32.28 $27.68 $28.20 $29.71 $24.22 $25.00 Merger Consideration: $41.75 $25.10 Price as of 1/4/23: $38.59 $19.79 $18.84 $15.00 $16.31 $15.98 $5.00 4.0%—5.0% 7.0%—8.0% WACC Terminal Yield 8.0x—9.0x 6.5x—7.5x Merger 2023E EBITDA 2023E DCF/LP Unit Premium 9.0%—11.0%—Analyst 7.25x—9.25x Selected 10.0% 13.0% Price 8.0x—9.0x 0.5%—1.5% 2022E EBITDA Range: Equity Equity Targets Exit Multiple Perpetuity Grow th Rate 8.0x—9.0x 6.0x—7.0x 15.0%—Cost of Cost of 2024E EBITDA 2024E DCF/LP Unit 30.0% Capital Capital Sensitivity Case B – Sensitivity Case C – Sensitivity Case D –DCP Financial Projections NYMEX Strip Pricing Case Higher Commodity Prices Lower Commodity Prices [Graphic Appears Here] 1. For reference only: sensitivity case using a 5% annual distribution growth rate which assumes lower than the commodity super cycle board assumption of 7.5% growth and higher than DCP Financial Projections’ 0% growth

Executive Summary Benefits to the Partnership of the Merger â—¼ Simplified structure â—¼ Reduced cost of capital under the Parent’s capital structure and improved access to capital â—¼ Reduced pro forma leverage given ability to repay debt on an accelerated basis â—¼ Participation in pro forma cost savings and operating synergies including enhanced connectivity from wellhead to end markets â—¼ Greater flexibility and ability to pursue growth projects and strategic acquisitions â—¼ Reduced reporting requirements as a wholly-owned subsidiary of PSX

II. DCP Situation Analysis
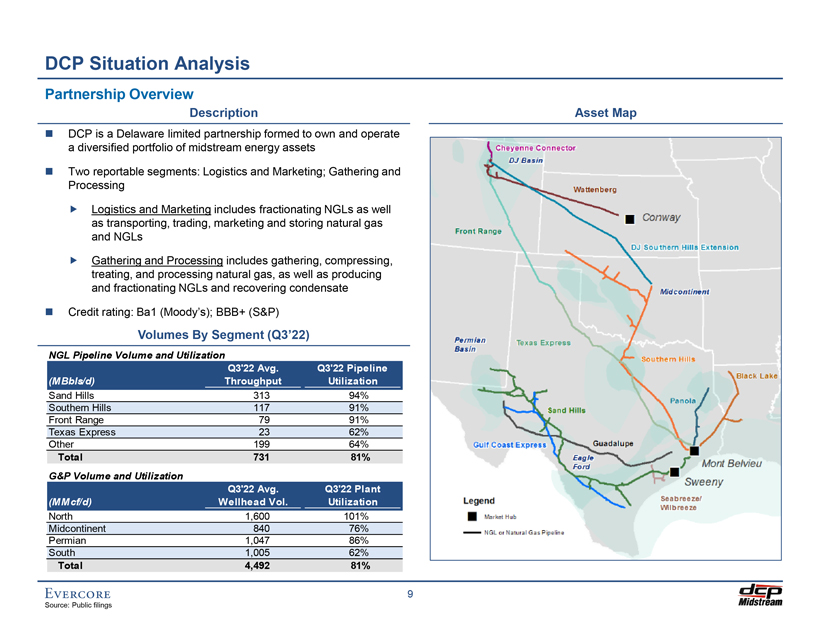
DCP Situation Analysis Partnership Overview Description DCP is a Delaware limited partnership formed to own and operate a diversified portfolio of midstream energy assets Two reportable segments: Logistics and Marketing; Gathering and Processing Logistics and Marketing includes fractionating NGLs as well as transporting, trading, marketing and storing natural gas and NGLs Gathering and Processing includes gathering, compressing, treating, and processing natural gas, as well as producing and fractionating NGLs and recovering condensate Credit rating: Ba1 (Moody’s); BBB+ (S&P) Volumes By Segment (Q3’22) NGL Pipeline Volume and Utilization Q3’22 Avg. Q3’22 Pipeline (MBbls/d) Throughput Utilization Sand Hills 313 94% Southern Hills 117 91% Front Range 79 91% Texas Express 23 62% Other 199 64% Total 731 81% G&P Volume and Utilization Q3’22 Avg. Q3’22 Plant (MMcf/d) Wellhead Vol. Utilization North 1,600 101% Midcontinent 840 76% Permian 1,047 86% South 1,005 62% Total 4,492 81% Asset Map

DCP Situation Analysis Logistics and Marketing Overview Logistics & Marketing segment is fee-based or fee-like and includes NGL and gas takeaway pipelines, marketing, trading, storage and fractionators DCP Logistics Assets Cheyenne Connector â—¼ Operated by Tallgrass â—¼ DCP 50% Owner Southern Hills Front Range â—¼ DCP 67% owner â—¼ Operated by EPD â—¼ DCP 33% owner Texas Express Gulf Coast Express â—¼ Operated by EPD â—¼ Operated by KMI â—¼ DCP 10% Owner â—¼ DCP 25% owner Mont Belvieu â—¼ DCP 12.5% owner in the Enterprise fractionator â—¼ DCP 20% owner in Mont Belvieu 1 fractionator Legend: DCP operated Third party operated Guadalupe Market Hub â—¼ Waha to New Braunfels 50%/50% DCP/EPD Sand Hills NGL or Natural â—¼ New Braunfels to Dewville 100% DCP â—¼ DCP 67% owner Gas Pipeline â—¼ Dewville to Katy 50%/50% DCP/ETC Katy â—¼ Katy Header 100% DCP [Graphic Appears Here] % Ownership / Segment Description Operated Sand Hills provides NGL takeaway / from the Permian and Eagle Ford to 67% the Gulf Coast Southern Hills provides NGL 67% / takeaway from the DJ Basin and the NGL Midcontinent to Gulf Coast markets Takeaway Front Range / Texas Express provide NGL takeaway from the DJ 33% / 10% / Basin Both operated by Enterprise Products Partners L.P. (“EPD”) Gulf Coast Express provides ~2.0 25% / Bcf/d gas takeaway from the Permian to the Gulf Coast Operated by Kinder Morgan, Inc. (“KMI”) Guadalupe provides 245 MMcf/d Gas 50% / gas takeaway from the Permian Takeaway Cheyenne Connector provides 600 50% / MMcf/d gas takeaway from the DJ Basin to the Rockies Express Pipeline Operated by Tallgrass Energy Partners, LP (“Tallgrass”) 12 Bcf Spindletop natural gas 100% / storage facility in SE Texas Gas & NGL 8 MMBbls Marysville NGL storage Storage 100% / facility in Michigan Equity ownership of 56 MBpd of 12.5% / 20% / Mont Belvieu fractionation Fractionation capacity Additional field fractionation capacity of 70 MBpd

DCP Situation Analysis Gathering and Processing Overview North Assets DJ Basin â—¼ 10 active plants â—¼ 1,160 MMcf/d capacity â—¼ ~3,000 miles of gathering Michigan/Collbran â—¼ 3 active treaters â—¼ 420 MMcf/d capacity â—¼ ~500 miles of gathering Select Customers [Graphic Appears Here] Permian Assets / James Lake Delaware Basin â—¼ 4 active plants â—¼ 640 MMcf/d capacity â—¼ ~6,700 miles of gathering Midland Basin/Other â—¼ 7 active plants â—¼ 700 MMcf/d capacity â—¼ ~8,700 miles of gathering Select Customers [Graphic Appears Here] South Assets Asset type Fractionator & Plant Natural Gas Plant NGL Pipeline Natural Gas Pipeline Eagle Ford â—¼ 4 active plants â—¼ 690 MMcf/d capacity â—¼ ~5,000 miles of gathering East Texas â—¼ 1 active plant â—¼ 400 MMcf/d capacity â—¼ ~1,000 miles of gathering Gulf Coast/Other â—¼ 2 active plants â—¼ 540 MMcf/d capacity â—¼ ~1000 miles of gathering Select Customers [Graphic Appears Here] Midcontinent Assets SCOOP/STACK â—¼ 5 active plants â—¼ 560 MMcf/d capacity â—¼ ~10,000 miles of gathering Liberal/Panhandle â—¼ 1 active plant â—¼ 550 MMcf/d capacity â—¼ ~13,500 miles of gathering Select Customers [Graphic Appears Here] Note: Number of active processing plants and active plant capacity excludes idled plants and includes DCP’s proportionate ownership share of capacity. Delaware Basin includes recently acquired James Lake System

DCP Situation Analysis DCP Organizational Structure [Graphic Appears Here] Economic Interests 43.3% DCP Midstream, LP 6.5% Gray Oak Pipeline, LLC [Graphic Appears Here] Economic Interests 13.2% DCP Midstream, LP 58.5% Gray Oak Pipeline, LLC DCP Midstream, LLC (Merged JV) Phillips 66 oversees and manages DCP GP and LP interests Enbridge oversees and manages GOP interest Public Unitholders 43.5% LP [Graphic Appears Here] 100.0% GP 56.5% LP 65.0% [Graphic Appears Here] Other JV Partners 35.0% Source: Public filings

DCP Situation Analysis Market Capitalization As of January 4, 2023 Total Units Outstanding1 209 Common Unit Price $38.59 Total Equity Value $8,066 Plus: Preferred Equity 761 Plus: Net Debt 4,730 Plus: Noncontrolling Interest 25 Enterprise Value $13,582 DCP Financial Projections Consensus Data Metric Yield/Multiple Metric Yield/Multiple Distribution Yield Current $1.72 4.5% $1.72 4.5% 2022E 1.64 4.2% 1.68 4.4% 2023E 1.72 4.5% 1.81 4.7% EV/EBITDA 2022E $1,749 7.8x $1,776 7.6x 2023E 1,698 8.0 1,750 7.8 2024E 1,578 8.6 1,665 8.2 ($ in millions, except per unit amounts) Balance Sheet and Credit Data As of September 30, 2022 Cash and Marketable Securities $93 Short-Term Debt 506 Long-Term Debt 4,317 Total Debt $4,823 Net Debt $4,730 Plus: Noncontrolling Interest 25 Plus: Preferred Equity 761 Plus: Partners’ Capital 5,600 Net Book Capitalization $11,116 Revolver Availability / Total Revolver Capacity $1,390 / $1,400 Net Debt / Net Book Cap 42.6% Net Debt / 2022E EBITDA 2.7x Net Debt / 2023E EBITDA 2.7 Unit Price and Distribution [Graphic Appears Here] Distribution per Unit Unit Price Source: DCP filings, FactSet as of January 4, 2023 1. Includes 117.8mm common units held by DCP Midstream, LLC and DCP Midstream GP, LP, and 0.6mm phantom and performance units

DCP Situation Analysis DCP Wall Street Research Summary Price Targets Firm Analyst Date Recommendation Target Price Wells Fargo Michael Blum 12/15/22 Hold $39.00 Stifel Selman Akyol 12/12/22 Buy 45.00 Mizuho Gabriel Moreen 12/2/22 Buy 45.00 Raymond James J.R. Weston 11/4/22 Buy 45.00 RBC Elvira Scotto 11/3/22 Hold 38.00 Median: $45.00 Mean: 42.40 High: 45.00 Low: 38.00 ($ in millions, except per unit amounts) Analyst Recommendations [Graphic Appears Here] Distribution Per Unit Estimates EBITDA Estimates [Graphic Appears Here] [Graphic Appears Here] 2023E 2024E 2025E Wells Fargo Stifel Mizuho Raymond James 2023E 2024E 2025E RBC FactSet Consensus DCP Financial Projections Source: FactSet, public filings; as of January 4, 2023 Note: Analyst estimates do not reflect information provided by P66 on how P66 plans to manage DCP going forward if the Merger were not to proceed

DCP Situation Analysis Analyst Price Targets and Comparison of Valuation Methodologies Price Target Date Broker Valuation Methodology Based on PSX’s original buyout offer of $34.75/unit plus an assumption that the company raises its offer $39.00 15-Dec-22 by ~12% based on past midstream simplification transactions $45.00 12-Dec-22 Derived by applying a 9.0x multiple to Stifel’s 2023 EBITDA estimate of $1.7 billion Blended valuation based on: (1) a 10-year, three-stage distribution/dividend discount model; (2) forward $45.00 4-Nov-22 free cash flow yield relative to comparable industry peers; and (3) forward enterprise value-to-EBITDA multiples relative to comparable industry peers $38 price target using PSX’s $34.75 offer price and adding a 10% premium, based on some previous $38.00 3-Nov-22 transactions in the space. The $38 price target represents an overall EV/EBITDA of ~6.9x and a target yield of 4.3% off of RBC’s one-year-out annualized distribution estimate Premium / 16.6% (Discount) 1.1% 16.6% (1.5%) to Current $45.00 Merger $45.00 Consideration: $41.75 $39.00 $38.00 Current Unit Price¹: $38.59 [Graphic Appears Here] [Graphic Appears Here] Source: Wall Street research, FactSet Note: Analyst estimates do not reflect information provided by P66 on how P66 plans to manage DCP going forward if the Merger were not to proceed 1. Unit price as of January 4, 2023

DCP Situation Analysis Ratings Agency Commentary The credit profile is now closely tied to PSX and agencies anticipate continued debt reduction Current Ratings Senior Unsecured BBB+ Senior Unsecured Ba1 Outlook Stable Outlook Positive Analyst Mike Llanos Analyst James Wilkins Recent Comments S&P’s Credit Opinion: August 18, 2022 â—¼ The stable outlook reflects expectation that Phillips 66 will fully integrate DCP’s assets into its midstream operations while the partnership maintains S&P Global Ratings-adjusted leverage of less than 4x over the intermediate term â—¼ The partnership is 70% fee-based allowing it to capitalize on the above-average commodity price, however this level of direct commodity price exposure makes the partnership more susceptible to cash flow volatility What could prompt an UPGRADE: ï,„ Would only raise rating on DCP if they raise rating on Phillips 66ï,„ Could raise PSX rating if non-refining segments account for much larger share of future consolidated EBITDA, which would mitigate cash flow volatility of its refining assets What could prompt a DOWNGRADE: ï,„ If Phillips 66’s adjusted debt to EBITDA consistently exceeds 3.0x Moody’s Credit Opinion: August 19, 2022 â—¼ Expects credit metrics will continue to improve and be supportive of an investment grade rating as free cash flow continues to be applied towards debt reduction â—¼ Credit challenges include exposure to regulatory risk for DJ Basin operations in the state of Colorado and uncertainty regarding longer term demand for hydrocarbons What could prompt an UPGRADE: ï,„ EBITDA continues to grow ï,„ Debt to EBITDA is maintained below 4.0x on a sustained basisï,„ Distribution coverage remains above 1.3x What could prompt a DOWNGRADE: ï,„ Debt to EBITDA exceeds 4.5x ï,„ Distribution coverage falls below 1.0x Source: Standard & Poor’s Rating Services and Moody’s

DCP Situation Analysis DCP Midstream, LP Common Unit Ownership Summary Top 20 Institutional Unit Holders Rank Investor Type Units (000’s) % of Total 1 ALPS Advisors, Inc. Investment Adviser 12,890 6.2% 2 Tortoise Capital Advisors LLC Investment Adviser 8,892 4.3% 3 Harvest Fund Advisors LLC Investment Adviser 8,075 3.9% 4 Goldman Sachs Asset Management LP Investment Adviser 5,711 2.7% 5 JPMorgan Securities LLC Investment Adviser 4,591 2.2% 6 Chickasaw Capital Management LLC Investment Adviser 3,136 1.5% 7 Citigroup Global Markets, Inc. (Investment Management) Investment Adviser 2,241 1.1% 8 ClearBridge Investments LLC Investment Adviser 2,108 1.0% 9 Global X Management Co. LLC Investment Adviser 2,094 1.0% 10 Barclays Bank Plc Private Banking/Wealth Mgmt 1,792 0.9% 11 Invesco Advisers, Inc. Investment Adviser 1,757 0.8% 12 RR Advisors LLC Hedge Fund Manager 1,379 0.7% 13 Bank of America, NA (Private Banking) Private Banking/Wealth Mgmt 1,281 0.6% 14 First Trust Advisors LP Investment Adviser 1,154 0.6% 15 CIBC Private Wealth Advisors, Inc. Investment Adviser 952 0.5% 16 Eagle Global Advisors LLC Private Banking/Wealth Mgmt 880 0.4% 17 Wells Fargo Bank, NA Private Banking/Wealth Mgmt 867 0.4% 18 Infrastructure Capital Advisors LLC Investment Adviser 855 0.4% 19 Antara Capital LP Hedge Fund Manager 790 0.4% 20 UBS Securities LLC Broker 769 0.4% Remainder 10,750 5.2% Total Institutional Ownership 72,963 35.0% Unit Ownership Breakdown [Graphic Appears Here] Unit Ownership Summary Holder Units (000’s) Ownership % Institutional 72,963 35.0% Insiders 3,808 1.8% Retail 13,863 6.7% Total Common Units Outstanding 90,634 43.5% Plus: PSX and ENB Owned Common Units 117,763 56.5% Total Units Outstanding1 208,397 100.0% Source: Wall Street research, FactSet; as of January 4, 2023 1. Excludes 0.6mm phantom and performance units

III. DCP Financial Projections

DCP Financial Projections DCP Financial Projections – Assumptions â—¼ A The DCP Financial Projections as provided by DCP Management and reviewed by Evercore, incorporate the following assumptions:ï,„ September 23, 2022 price deck as follows: Price Deck 2022E 2023E 2024E 2025E 2026E 2027E NGLs ($/Gal) $1.04 $0.75 $0.66 $0.60 $0.60 $0.60 WTI ($/Bbl) 93.75 73.80 68.04 64.12 61.16 58.81 Henry Hub ($/MMBtu) 7.26 5.56 4.76 4.59 4.52 4.50 ï,„ Interest rates on debt as follows: • Revolving Credit Facility: Approximately 4.5%-5.5% annually • Permanent Debt Average: Approximately 5.5%-6.0% annuallyï,„ Preferred Equity redeemed once eligible and financed with debt and cash flow from operations: • $500 Series A redeemed in Q3 2022 • $161 Series B redeemed in Q2 2023 • $110 Series C redeemed in Q4 2023ï,„ Common Units outstanding: • 90.6 million publicly held LP Units • 117.8 million DCP LP Units ï,„ Quarterly distributions per LP held flat at $0.43/unit throughout the projection periodï,„ No minimum cash balance ï,„ Maintenance capital expenditures of $134.7 million per year in 2022E, $150.0 million per year in 2023E and 2024E and $125.0 million per year from 2025E to 2027Eï,„ Growth capital expenditures: • Identified organic capital expenditures of $114.4 million in 2H 2022 • Identified acquisition capital expenditures of $144.0 million in 2H 2022 • Unidentified organic capital expenditures of $125.0 million in 2023E and $50.0 million per year from 2024E to 2027E NGL Composite Pricing .20 DCP Financial Projections .00 $0.95 0 . 0 $0.75 .80 1 3 $ $0.66 8 $0.60 $0.60 $0.60 0 . .60 $ 71 8 . 0 . 6 5 5 5 $ 0 . 6 6 .. 6 $ . .40 $ 0 0 $ 0 $ .20 $— A 2021 2022A E 2023 E 2024 2025E E 2026 2027 E Historical NYMEX Strip Pricing (01/03/23) [Graphic Appears Here] Source: DCP Management Note: DCP Financial Projections do not include effects of the Merger

DCP Financial Projections DCP Financial Projections – Sensitivity Assumptions â—¼ At the direction of the Special Committee, Evercore requested that DCP Management provide financial projections for DCP B assuming NYMEX Strip Pricing as of January 3, 2023 (“Sensitivity Case B – NYMEX Strip Pricing Case”): NYMEX Strip Pricing Case 2022E 2023E 2024E 2025E 2026E 2027E NGLs ($/Gal) $1.04 $0.71 $0.68 $0.66 $0.66 $0.66 WTI ($/Bbl) 93.75 76.58 72.42 68.61 65.57 62.98 Henry Hub ($/MMBtu) 7.26 3.90 4.14 4.31 4.41 4.45 â—¼ Also at the direction of the Special Committee, the following two additional commodity price cases were requested to reflect higher and lower price environments, although these levels have not been realized historically over a long period of time: â—¼ C A sensitivity case which assumes the following higher commodity pricing (“Sensitivity Case C – Higher Commodity Prices”): Higher Commodity Prices 2022E 2023E 2024E 2025E 2026E 2027E NGLs ($/Gal) $1.01 $0.90 $0.78 $0.77 $0.76 $0.75 WTI ($/Bbl) 95.10 87.50 76.50 75.50 74.50 73.50 Henry Hub ($/MMBtu) 6.50 5.85 5.15 5.10 5.05 5.00 â—¼ D A sensitivity case which assumes the following lower commodity pricing (“Sensitivity Case D – Lower Commodity Prices”): Lower Commodity Prices 2022E 2023E 2024E 2025E 2026E 2027E NGLs ($/Gal) $1.01 $0.59 $0.42 $0.42 $0.42 $0.42 WTI ($/Bbl) 95.10 40.00 40.00 40.00 40.00 40.00 Henry Hub ($/MMBtu) 6.50 2.25 2.25 2.25 2.25 2.25

DCP Financial Projections DCP Financial Projections – NGL Price Cases NGL Composite Barrel ($/Gal) Historicals Average Historicals DCP Financial Projections NYMEX Strip Pricing Case Higher Commodity Prices Lower Commodity Prices

DCP Financial Projections A DCP Financial Projections ($ in millions) For the Years Ending December 31, 2022E-2027E 2022E 2023E 2024E 2025E 2026E 2027E CAGR Gathering & Processing Segment North Region $1,140 $864 $767 $726 $717 $711 (9.0%) South Region 191 147 137 129 128 127 (7.9%) Midcontinent Region 275 239 225 212 209 207 (5.5%) Permian Region 584 585 562 533 527 522 (2.2%) Other G&P -——————- Total Gathering & Processing Gross Margin $2,190 $1,835 $1,690 $1,601 $1,581 $1,568 (6.5%) Total Costs North Region ($157) ($144) ($154) ($154) ($156) ($158) 0.2% South Region (99) (99) (92) (92) (94) (95) (0.8%) Midcontinent Region (165) (162) (174) (174) (177) (179) 1.6% Permian Region (251) (293) (307) (308) (312) (317) 4.7% Other G&P (19) (23) (20) (21) (21) (21) 2.6% Total Gathering & Processing Costs ($691) ($721) ($748) ($748) ($760) ($771) 2.2% Total Gathering & Processing Segment Margin $1,499 $1,113 $942 $852 $821 $797 (11.9%) Logistics & Marketing Segment Southern Hills + Sand Hills $429 $436 $442 $449 $449 $449 0.9% Other NGL Pipelines 141 149 156 158 158 158 2.3% NGL Marketing + Storage 46 49 39 39 39 39 (3.2%) Downstream Fractionation 19 21 21 21 21 21 2.0% Gas Marketing + Other Income 18 13 13 13 13 13 (7.1%) Gas Storage 2 13 12 12 12 12 43.2% Guadalupe 62 48 40 40 40 40 (8.5%) Gulf Coast Express Equity Earnings 66 66 66 66 66 66 (0.0%) Cheyenne Connector Equity Earnings 14 14 14 14 14 14 0.0% Total Logistics & Marketing Gross Margin $798 $810 $804 $812 $812 $812 0.4% Total Costs Logistics & Marketing Costs ($44) ($47) ($41) ($41) ($42) ($42) (0.9%) Total Logistics & Marketing Segment Margin $754 $763 $763 $771 $771 $770 0.4% Source: DCP Management

DCP Financial Projections A DCP Financial Projections – Summary Cash Flows ($ in millions, except per unit amounts) For the Years Ending December 31, 2022E-2027E 2022E 2023E 2024E 2025E 2026E 2027E CAGR Gathering & Processing Segment Margin $1,499 $1,113 $942 $852 $821 $797 (11.9%) Logistics & Marketing Segment Margin 754 763 763 771 771 770 0.4% Less: Corporate Costs (255) (257) (236) (236) (239) (243) (1.0%) Plus: Adj. Distribution in Excess of Equity Earnings—Logistics 77 80 80 80 80 80 0.9% Plus: Adj. Distribution in Excess of Equity Earnings—Discovery 13 9 9 9 9 9 (7.3%) Plus: Hedge settlement (339) (11) 2 (4) -—- Adjusted EBITDA $1,749 $1,698 $1,560 $1,473 $1,442 $1,414 (4.2%) Plus: Growth Projects -—- 18 25 32 39 Total Adjusted EBITDA $1,749 $1,698 $1,578 $1,498 $1,474 $1,453 (3.6%) Less: Interest Expense ($273) ($286) ($258) ($221) ($210) ($183) Less: Preferred Securities (58) (15) -———-Less: Sustaining Capital (135) (150) (150) (125) (125) (125) Less: Income Taxes (5) (5) (5) (5) (5) (5) Less: Other (3) (7) (7) (5) (5) (5) Distributable Cash Flow $1,275 $1,235 $1,157 $1,142 $1,128 $1,135 (2.3%) Identified Organic Capital ($140) $— $— $— $— $—Unidentified Organic Capital — (125) (50) (50) (50) (50) Acquisition Capital (160) -————- Distributions (342) (359) (359) (359) (359) (359) 1.0% Working Capital and Interest Timing (30) 133 90 -——- Cash Surplus / (Shortfall) $603 $884 $838 $733 $719 $726 3.8% LP Units Outstanding 208 209 209 209 209 209 0.0% Distributable Cash Flow per LP Unit $6.12 $5.92 $5.55 $5.47 $5.41 $5.44 (2.3%) Distribution per Unit 1.64 1.72 1.72 1.72 1.72 1.72 1.0% Total Distributions $342 $359 $359 $359 $359 $359 1.0% Source: DCP Management

DCP Financial Projections A DCP Financial Projections – Sources and Uses ($ in millions) For the Years Ending December 31, 2022E 2023E 2024E 2025E 2026E 2027E Sources DCF Surplus / (Shortfall) $603 $884 $838 $733 $719 $726 Revolver Draw 246 -————- Total Sources $849 $884 $838 $733 $719 $726 Uses Revolver Paydown $— $113 $393 $— $— $— Long-Term Debt Paydown 350 500 — 825 — 500 Preferred Equity Redemption 500 271 -———-Cash Balance Increase / (Decrease) (1) — 445 (92) 719 226 Total Uses $849 $884 $838 $733 $719 $726 Memo: Cash $— $— $445 $353 $1,073 $1,298 Total Debt 5,331 4,718 4,325 3,500 3,500 3,000 Net Debt $5,331 $4,718 $3,880 $3,147 $2,427 $1,702 Preferred Equity 271 -————- Net Debt + Preferred Equity $5,602 $4,718 $3,880 $3,147 $2,427 $1,702 Total Debt / Adjusted EBITDA 3.0x 2.8x 2.7x 2.3x 2.4x 2.1x Net Debt / Adjusted EBITDA 3.0 2.8 2.5 2.1 1.6 1.2 (Net Debt + Preferred Equity) / Adjusted EBITDA 3.2 2.8 2.5 2.1 1.6 1.2 Source: DCP Management

DCP Financial Projections B DCP Financial Projections ($ in millions) For the Years Ending December 31, 2022E-2027E 2022E 2023E 2024E 2025E 2026E 2027E CAGR Gathering & Processing Segment North Region $1,140 $729 $752 $758 $756 $756 (7.9%) South Region 191 151 144 138 136 135 (6.8%) Midcontinent Region 275 243 231 218 214 211 (5.2%) Permian Region 584 568 565 542 535 531 (1.9%) Other G&P -——————- Total Gathering & Processing Gross Margin $2,190 $1,691 $1,692 $1,655 $1,641 $1,633 (5.7%) Total Costs North Region ($157) ($144) ($154) ($154) ($156) ($158) 0.2% South Region (99) (99) (92) (92) (94) (95) (0.8%) Midcontinent Region (165) (162) (174) (174) (177) (179) 1.6% Permian Region (251) (293) (307) (308) (312) (317) 4.7% Other G&P (19) (23) (20) (21) (21) (21) 2.6% Total Gathering & Processing Costs ($691) ($721) ($748) ($748) ($760) ($771) 2.2% Total Gathering & Processing Segment Margin $1,499 $970 $944 $907 $881 $862 (10.5%) Logistics & Marketing Segment Southern Hills + Sand Hills $429 $436 $442 $449 $449 $449 0.9% Other NGL Pipelines 141 149 156 158 158 158 2.3% NGL Marketing + Storage 46 49 39 39 39 39 (3.2%) Downstream Fractionation 19 21 21 21 21 21 2.0% Gas Marketing + Other Income 18 13 13 13 13 13 (7.1%) Gas Storage 2 13 12 12 12 12 43.2% Guadalupe 62 48 40 40 40 40 (8.5%) Gulf Coast Express Equity Earnings 66 66 66 66 66 66 (0.0%) Cheyenne Connector Equity Earnings 14 14 14 14 14 14 0.0% Total Logistics & Marketing Gross Margin $798 $810 $804 $812 $812 $812 0.4% Total Costs Logistics & Marketing Costs ($44) ($47) ($41) ($41) ($42) ($42) (0.9%) Total Logistics & Marketing Segment Margin $754 $763 $763 $771 $771 $770 0.4% Source: DCP Management

DCP Financial Projections B DCP Financial Projections – Summary Cash Flows ($ in millions, except per unit amounts) For the Years Ending December 31, 2022E-2027E 2022E 2023E 2024E 2025E 2026E 2027E CAGR Gathering & Processing Segment Margin $1,499 $970 $944 $907 $881 $862 (10.5%) Logistics & Marketing Segment Margin 754 763 763 771 771 770 0.4% Less: Corporate Costs (255) (257) (236) (236) (239) (243) (1.0%) Plus: Adj. Distribution in Excess of Equity Earnings—Logistics 77 80 80 80 80 80 0.9% Plus: Adj. Distribution in Excess of Equity Earnings—Discovery 13 9 9 9 9 9 (7.3%) Plus: Hedge settlement (339) 18 4 (2) -—- Adjusted EBITDA $1,749 $1,583 $1,563 $1,530 $1,501 $1,478 (3.3%) Plus: Growth Projects -—- 18 25 32 39 Total Adjusted EBITDA $1,749 $1,583 $1,581 $1,555 $1,534 $1,518 (2.8%) Less: Interest Expense ($273) ($290) ($261) ($222) ($210) ($183) Less: Preferred Securities (58) (15) -———-Less: Sustaining Capital (135) (150) (150) (125) (125) (125) Less: Income Taxes (5) (5) (5) (5) (5) (5) Less: Other (3) (7) (7) (5) (5) (5) Distributable Cash Flow $1,275 $1,115 $1,158 $1,198 $1,188 $1,199 (1.2%) Identified Organic Capital ($140) $— $— $— $— $—Unidentified Organic Capital — (125) (50) (50) (50) (50) Acquisition Capital (160) -————- Distributions (342) (359) (359) (359) (359) (359) 1.0% Working Capital and Interest Timing (30) 133 90 -——- Cash Surplus / (Shortfall) $603 $764 $839 $789 $779 $790 5.6% LP Units Outstanding 208 209 209 209 209 209 0.0% Distributable Cash Flow per LP Unit $6.12 $5.34 $5.55 $5.74 $5.69 $5.75 (1.2%) Distribution per Unit 1.68 1.72 1.72 1.72 1.72 1.72 0.5% Total Distributions $342 $359 $359 $359 $359 $359 1.0% Source: DCP Management

DCP Financial Projections B DCP Financial Projections – Sources and Uses ($ in millions) For the Years Ending December 31, 2022E 2023E 2024E 2025E 2026E 2027E Sources DCF Surplus / (Shortfall) $603 $764 $839 $789 $779 $790 Revolver Draw 246 7 -———- Total Sources $849 $771 $839 $789 $779 $790 Uses Revolver Paydown $— $— $513 $— $— $— Long-Term Debt Paydown 350 500 — 825 — 500 Preferred Equity Redemption 500 271 -———-Cash Balance Increase / (Decrease) (1) — 327 (36) 779 290 Total Uses $849 $771 $839 $789 $779 $790 Memo: Cash $— $— $327 $291 $1,070 $1,360 Total Debt 5,331 4,838 4,325 3,500 3,500 3,000 Net Debt $5,331 $4,838 $3,998 $3,209 $2,430 $1,640 Preferred Equity 271 -————- Net Debt + Preferred Equity $5,602 $4,838 $3,998 $3,209 $2,430 $1,640 Total Debt / Adjusted EBITDA 3.0x 3.1x 2.7x 2.3x 2.3x 2.0x Net Debt / Adjusted EBITDA 3.0 3.1 2.5 2.1 1.6 1.1 (Net Debt + Preferred Equity) / Adjusted EBITDA 3.2 3.1 2.5 2.1 1.6 1.1 Source: DCP Management

DCP Financial Projections DCP Financial Projections Summary – Comparison to Wall Street Consensus Estimates ($ in millions) Adjusted EBITDA [Graphic Appears Here] Distributed Cash Flow Coverage Ratio: [Graphic Appears Here] [Graphic Appears Here] Distributable Cash Flow [Graphic Appears Here] Net Debt / Adjusted EBITDA [Graphic Appears Here] DCP Financial Projections Wall Street Consensus Estimates Source: DCP Management; FactSet; as of January 4, 2023

DCP Financial Projections DCP Financial Projections Summary – Comparison to Sensitivity Cases ($ in millions) Adjusted EBITDA [Graphic Appears Here] Distributed Cash Flow1 Coverage Ratio: [Graphic Appears Here] [Graphic Appears Here] Distributable Cash Flow [Graphic Appears Here] Net Debt / Adjusted EBITDA [Graphic Appears Here] Sensitivity Case B – Sensitivity Case C – Sensitivity Case D –DCP Financial Projections NYMEX Strip Pricing Case Higher Commodity Prices Lower Commodity Prices Source: DCP Management 1. Projected distributions remain the same through sensitivity cases

DCP Financial Projections DCP Financial Projections Summary – Comparison to Sensitivity Cases ($ in millions) Adjusted EBITDA [Graphic Appears Here] Distributed Cash Flow1 Coverage Ratio: [Graphic Appears Here] [Graphic Appears Here] Distributable Cash Flow [Graphic Appears Here] Net Debt / Adjusted EBITDA [Graphic Appears Here] Sensitivity Case B – Sensitivity Case C – Sensitivity Case D –DCP Financial Projections NYMEX Strip Pricing Case Higher Commodity Prices Lower Commodity Prices Source: DCP Management 1. Projected distributions remain the same through sensitivity cases IV. Preliminary Valuation of the Common Units

Preliminary Valuation of the Common Units Valuation Methodologies â—¼ Evercore utilized the following methodologies to analyze the value of the Common Units: Methodology Description Assumptions / Detail â—¼ Values the Common Units based on the concept of â—¼ Projected cash flow discounted to 12/31/22 the time value of money â—¼ Utilizes varying weighted average cost of capital â—¼ EBITDA exit multiple based on peer group trading multiples and Discounted (“WACC”) discount rates and applies various precedent transaction multiples Cash Flow perpetuity growth rates to derive after-tax valuation â—¼ WACC based on the Capital Asset Pricing Model (“CAPM”) Analysis ranges â—¼ Calculated terminal values based on a range of multiples of EBITDA and assumed perpetuity growth rates â—¼ Values the Common Units based on the present value â—¼ Projected distributions discounted to 12/31/22 of the future cash distributions Discounted â—¼ Terminal yield range based on the distribution yield at which DCP Distributions has traded over the last 52 weeks Analysis â—¼ Cost of equity based on CAPM and total expected market return for MLPs and companies with similar assets to those of DCP â—¼ Values the Common Units based on EV/EBITDA and â—¼ EV/EBITDA multiples applied to 2023E and 2024E EBITDA Peer Group Price/DCF trading multiples â—¼ Price/DCF LP unit applied to 2023E and 2024E DCF/LP unit Trading â—¼ Multiples selected based on EV/EBITDA and Analysis Price/DCF multiples of MLPs and companies with assets similar to those owned by DCP Precedent â—¼ Values the Common Units based on multiples of â—¼ EV/EBITDA multiples applied to 2022E EBITDA M&A transaction value to EBITDA in historical transactions involving assets similar to those owned by DCP Transaction Analysis For Premiums â—¼ Values DCP common units based on historical â—¼ Median 1-Day spot and 20-Day volume weighted average price Reference premiums paid in (i) MLP buy-ins and (ii) MLP mergers (“VWAP”) premiums paid applied to relevant unit prices Only Paid Analysis since 2018

Preliminary Valuation of the Common Units Preliminary Valuation Summary For Reference Only Discounted Peer Group Discounted Cash Flow Analysis Distributions Trading Analysis MLP Analyst Analysis Precedent M&A Premiums Price Transaction Analysis Paid Targets Market Price/DCF Exit Multiple Perpetuity Grow th CAPM EV/EBITDA Return per LP Unit $65.00 $61.07 Implied range based on 5% $55.00 annual $53.18 $52.70 $52.17 distribution growth $50.33 $50.20 $50.20 $49.58 $48.61 $48.61 through $45.40 2027E1 $45.91 $44.37 $45.00 $45.00 $43.31 $44.05 $44.86 $41.61 $40.99 $40.08 $42.24 $38.33 $37.83 $38.44 $39.96 $38.00 $35.00 $34.93 $37.36 $36.05 $35.15 $32.22 $33.35 $33.44 $33.27 $33.41 $33.27 $33.30 $29.52 $33.56 $33.56 $28.75 $32.28 $32.28 $27.68 $28.20 $29.71 $24.22 $25.00 Merger Consideration: $41.75 $25.10 Price as of 1/4/23: $38.59 $19.79 $18.84 $15.00 $16.31 $15.98 $5.00 4.0%—5.0% 7.0%—8.0% WACC Terminal Yield 8.0x—9.0x 6.5x—7.5x Merger 2023E EBITDA 2023E DCF/LP Unit Premium 9.0%—11.0%—Analyst 7.25x—9.25x Selected 10.0% 13.0% Price 8.0x—9.0x 0.5%—1.5% 2022E EBITDA Range: Equity Equity Targets Exit Multiple Perpetuity Grow th Rate 8.0x—9.0x 6.0x—7.0x 15.0%—Cost of Cost of 2024E EBITDA 2024E DCF/LP Unit 30.0% Capital Capital Sensitivity Case B – Sensitivity Case C – Sensitivity Case D –DCP Financial Projections NYMEX Strip Pricing Case Higher Commodity Prices Lower Commodity Prices 1. For reference only: sensitivity case using a 5% annual distribution growth rate which assumes lower than the commodity super cycle board assumption of 7.5% growth and higher than DCP Financial Projections’ 0% growth

Preliminary Valuation of the Common Units A Discounted Cash Flow Analysis ($ in millions, except per unit amounts) Summary Results For the Years Ending December 31, Exit Perpetuity 2023E 2024E 2025E 2026E 2027E Multiple Growth Adjusted EBITDA $1,698 $1,578 $1,498 $1,474 $1,453 $1,453 $1,453 Less: Tax Depreciation and Amortization¹ (14,251) (154) (127) (118) (116) (125) EBIT ($12,553) $1,424 $1,371 $1,356 $1,338 $1,328 Less: Cash Taxes — (84) (81) (100) (99) (491) EBIAT ($12,553) $1,340 $1,290 $1,255 $1,239 $837 Plus: Tax Depreciation and Amortization 14,251 154 127 118 116 125 Less: Maintenance Capex (150) (150) (125) (125) (125) (125) Less: Growth Capex (125) (50) (50) (50) (50) —Unlevered Free Cash Flow $1,423 $1,293 $1,242 $1,199 $1,179 $837 EBITDA Multiple / Perpetuity Growth Rate 8.5x 1.0% Implied Terminal Value $12,351 $13,000 Present Value of Terminal Value @ 7.5% Discount Rate $8,603 $8,734 Plus: Present Value of Unlevered Free Cash Flow @ 7.5% Discount Rate 5,351 Implied Enterprise Value $13,954 $14,085 Less: Preferred Equity2 ($271) Less: Net Debt2 (5,331) Less: Noncontrolling Interests2 (25) Implied Equity Value $8,327 $8,458 DCP Units Outstanding3 210 Implied Value per Unit $39.61 $40.23 Sensitivity Analysis Terminal Exit Multiple Perpetuity Growth Rate 7.5x 8.0x 8.5x 9.0x 9.5x —% 0.5% 1.0% 1.5% 2.0% 6.5% $37.07 $39.59 $42.11 $44.63 $47.16 6.5% $42.54 $46.38 $50.92 $56.37 $63.03 C C 7.0% 35.92 38.38 40.84 43.31 45.77 C C 7.0% 38.14 41.37 45.13 49.58 54.92 WA 7.5% 34.79 37.20 39.61 42.02 44.42 WA 7.5% 34.34 37.07 40.23 43.92 48.27 8.0% 33.70 36.05 38.40 40.76 43.11 8.0% 31.00 33.35 36.03 39.12 42.73 8.5% 32.64 34.93 37.23 39.53 41.83 8.5% 28.05 30.08 32.38 35.00 38.03 31 1. 2023E tax DD&A assumes 80% bonus depreciation calculated as the midpoint of the enterprise value range plus 2023E capital expenditures 2. Per DCP Management as of December 31, 2022 3. Includes 117.8mm common units held by DCP Midstream, LLC and DCP Midstream GP, LP, and 1.8mm phantom and performance units

Preliminary Valuation of the Common Units Discounted Distribution Analysis For the Years Ending December 31, Terminal Value 2023E 2024E 2025E 2026E 2027E Low High DCP Distribution per Unit (Cash, As Paid) $1.72 $1.72 $1.72 $1.72 $1.72 $1.72 – $1.72 Terminal Yield1 5.0% 4.0% Terminal Value $34.40 $43.00 Equity Cost of Capital Based on CAPM Present Value @ 8.5% Cost of Equity $29.94 – $35.66 Present Value @ 9.0% Cost of Equity 29.34 – 34.93 Present Value @ 9.5% Cost of Equity 28.76 – 34.23 Present Value @ 10.0% Cost of Equity 28.20 – 33.54 Present Value @ 10.5% Cost of Equity 27.65 – 32.87 Implied DCP Unit Value – Based on CAPM $28.20 – $34.93 Equity Cost of Capital Based on Total Expected Market Return2 Present Value @ 10.0% Cost of Equity $28.20 – $33.54 Present Value @ 11.0% Cost of Equity 27.11 – 32.22 Present Value @ 12.0% Cost of Equity 26.08 – 30.96 Present Value @ 13.0% Cost of Equity 25.10 – 29.77 Present Value @ 14.0% Cost of Equity 24.17 – 28.64 Implied DCP Unit Value – Based on Total Expected Market Return $25.10 – $32.22 Source: DCP Management 1. Based on DCP’s 52-week yield range of 2.6% to 5.6% with a median of 4.3% and mean of 4.3%; Current yield is 4.0% as of January 4, 2023 2. Detail on Equity Cost of Capital calculations in Appendix
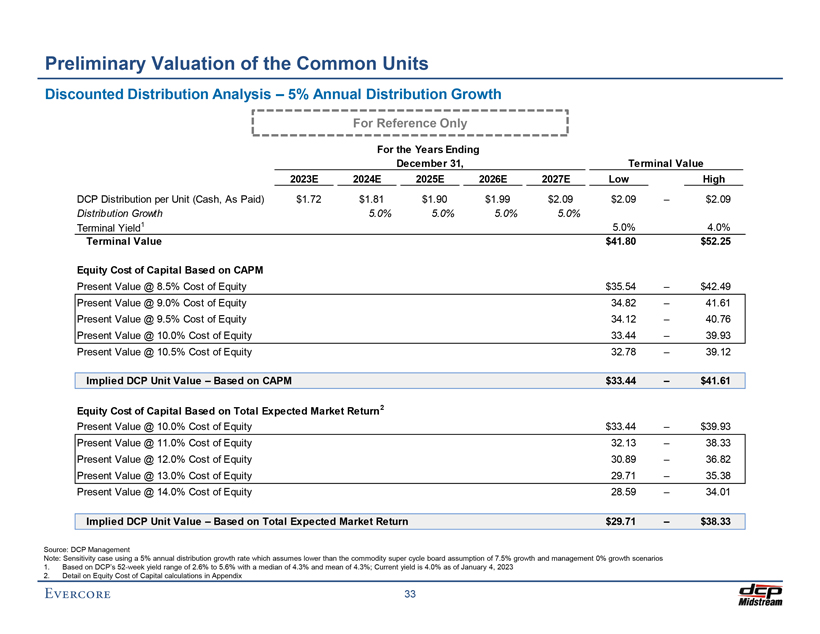
Preliminary Valuation of the Common Units Discounted Distribution Analysis – 5% Annual Distribution Growth For Reference Only For the Years Ending December 31, Terminal Value 2023E 2024E 2025E 2026E 2027E Low High DCP Distribution per Unit (Cash, As Paid) $1.72 $1.81 $1.90 $1.99 $2.09 $2.09 – $2.09 Distribution Growth 5.0% 5.0% 5.0% 5.0% Terminal Yield1 5.0% 4.0% Terminal Value $41.80 $52.25 Equity Cost of Capital Based on CAPM Present Value @ 8.5% Cost of Equity $35.54 – $42.49 Present Value @ 9.0% Cost of Equity 34.82 – 41.61 Present Value @ 9.5% Cost of Equity 34.12 – 40.76 Present Value @ 10.0% Cost of Equity 33.44 – 39.93 Present Value @ 10.5% Cost of Equity 32.78 – 39.12 Implied DCP Unit Value – Based on CAPM $33.44 – $41.61 Equity Cost of Capital Based on Total Expected Market Return2 Present Value @ 10.0% Cost of Equity $33.44 – $39.93 Present Value @ 11.0% Cost of Equity 32.13 – 38.33 Present Value @ 12.0% Cost of Equity 30.89 – 36.82 Present Value @ 13.0% Cost of Equity 29.71 – 35.38 Present Value @ 14.0% Cost of Equity 28.59 – 34.01 Implied DCP Unit Value – Based on Total Expected Market Return $29.71 – $38.33 Source: DCP Management Note: Sensitivity case using a 5% annual distribution growth rate which assumes lower than the commodity super cycle board assumption of 7.5% growth and management 0% growth scenarios 1. Based on DCP’s 52-week yield range of 2.6% to 5.6% with a median of 4.3% and mean of 4.3%; Current yield is 4.0% as of January 4, 2023 2. Detail on Equity Cost of Capital calculations in Appendix

Preliminary Valuation of the Common Units Peer Group Trading Analysis ($ in millions, except per unit/share amounts) Price/DCF Price Equity Enterprise Enterprise Value/EBITDA / CAFD per Share Distribution Yield Dist. Net Debt / Parthership / Company 1/4/23 Value Value 2023E 2024E 2023E 2024E Current 2023E Growth 2023E EBITDA Gathering & Processing MLPs/Companies Antero Midstream Corporation $10.89 $5,269 $8,639 9.1x 8.6x 9.1x 8.1x 8.3% 8.3% NM 3.5x Crestwood Equity Partners LP 26.56 2,859 7,263 8.0 7.6 4.8 4.4 9.9% 9.9% 3.7% 3.7 DT Midstream, Inc. 53.65 5,256 8,658 9.6 9.0 8.8 8.3 4.8% 5.0% 6.9% 3.6 EnLink Midstream, LLC 11.95 5,788 11,984 8.8 8.6 5.7 5.4 3.8% 4.2% 10.0% 3.4 Equitrans Midstream Corporation 6.85 2,997 10,441 9.9 9.1 5.4 5.0 8.8% 8.8% 0.8% 6.0 Hess Midstream Partners LP 30.02 7,205 10,111 9.7 9.2 8.3 7.9 7.5% 7.9% 4.0% 2.8 Kinetik Holdings Inc. 31.53 4,331 7,770 8.7 7.8 6.0 5.3 9.5% 10.0% 4.3% 3.8 ONEOK, Inc. 64.44 28,915 41,768 10.5 10.2 11.7 11.2 5.8% 5.8% 4.0% 3.2 Summit Midstream Partners, LP 16.51 174 1,905 6.3 6.1 NM NM —% —% NM 5.1 Targa Resources Corp. 71.03 16,403 30,825 8.9 8.7 6.4 6.3 2.0% 2.4% 10.0% 3.5 Western Midstream Partners, LP 25.89 10,267 17,076 7.7 7.5 6.8 6.2 7.7% 7.7% 10.9% 3.0 Mean 8.8x 8.4x 7.3x 6.8x 6.2% 6.4% 6.1% 3.8x Median 8.9 8.6 6.6 6.2 7.5% 7.7% 4.3% 3.5 DCP Midstream, LP (Consensus)1 $38.59 $8,066 $13,582 7.8x 8.2x 6.3x 6.6x 4.5% 4.7% 3.1% 2.7x DCP Midstream, LP (DCP Financial Projections)1 $38.59 $8,066 $13,582 8.0x 8.6x 6.5x 7.0x 4.5% 4.5% —% 3.0x Source: Company filings, FactSet, Wall Street Research; as of January 4, 2023

Preliminary Valuation of the Common Units Change in Valuation Multiples Over Time EV / NTM EBITDA Multiples1 14.0x 0.8x Average Differential from Peers Since 1/1/2018 1.2x Average Differential from Peers Since 1/1/2022 12.0x 10.0x 8.9x 8.0x 7.8x 6.0x 4.0x 2.0x --x 1/1/18 11/1/18 9/2/19 7/3/20 5/4/21 3/5/22 1/4/23 DCP Peer Median2 Source: FactSet market data as of January 4, 2023 1. EV / NTM EBITDA based on FactSet Consensus trading multiples 2. Peers include AM, CEQP, DTM, ENLC, ETRN, HESM, KNTK, OKE, SMLP, TRGP and WES

Preliminary Valuation of the Common Units A Peer Group Trading Analysis – EV/EBITDA ($ in millions, except per unit amounts) 2023E Adjusted EBITDA $1,698 Relevant EBITDA Multiple 8.0x—9.0x Implied Enterprise Value Based on 2023E Adjusted EBITDA $13,582—$15,280 Less: Preferred Equity1 (271) Less: Net Debt1 (5,331) Less: Noncontrolling Interests1 (25) Implied Equity Value $7,955—$9,652 DCP Units Outstanding 210 Implied DCP Unit Price Range—2023E EBITDA $37.84—$45.91 2024E Adjusted EBITDA $1,578 Relevant EBITDA Multiple 8.0x—9.0x Implied Enterprise Value Based on 2024E Adjusted EBITDA $12,621—$14,199 Less: Preferred Equity1 (271) Less: Net Debt1 (5,331) Less: Noncontrolling Interests1 (25) Implied Equity Value $6,994—$8,572 DCP Units Outstanding 210 Implied DCP Unit Price Range—2024E EBITDA $33.27—$40.77 Implied DCP Unit Price Range—2023E and 2024E EBITDA $33.27—$45.91 1. As of December 31, 2022

Preliminary Valuation of the Common Units A Peer Group Trading Analysis – Price/DCF per LP Unit ($ in millions, except per unit amounts) 2023E DCF / LP Unit $5.92 Relevant Multiple 6.5x—7.5x Implied DCP Unit Price Range—2023E Price / DCF $38.45—$44.37 2024E DCF / LP Unit $5.55 Relevant Multiple 6.0x—7.0x Implied DCP Unit Price Range—2024E Price / DCF $33.27—$38.82 Implied DCP Unit Price Range—2023E and 2024E Price / DCF $33.27—$44.37

Preliminary Valuation of the Common Units Precedent M&A Transaction Analysis ($ in millions) Gathering & Processing Transactions Date Transaction EBITDA Announced Acquiror / Target (Seller) Value ($MM) Multiple Oct-22 Summit Midstream / Outrigger DJ Midstream $165 6.8x Oct-22 Summit Midstream / Sterling DJ 140 3.0 Sep-22 Antero Midstream / Marcellus G&P System (Crestwood Equity Partners) 205 7.0 Jun-22 Targa Resources / Lucid Energy 3,550 7.5 Jun-22 DCP Midstream / James Lake System (Woodland Midstream II) 160 5.5 May-22 EnLink Midstream / Barnett Gathering and Processing System (Crestwood Equity Partners) 275 4.0 May-22 Crestwood Equity Partners / Sendero Midstream 600 7.0 Apr-22 Delek Logistics Partners / 3Bear Energy 625 8.8 Mar-22 Targa Resources / Southcross Energy Operating 200 4.0 Mar-22 Williams Companies / Trace Midstream 950 6.0 Jan-22 Enterprise Products Partners / Navitas Midstream Partners 3,250 7.8 Oct-21 Crestwood Equity Partners / Oasis Midstream 1,848 8.3 Oct-21 Altus Midstream / BCP Raptor/EagleClaw Midstream 6,248 11.7 Apr-21 EnLink Midstream LLC / Amarillo Rattler JV (Rattler Midstream Partners LP, Amarillo Midstream) 60 6.0 Aug-20 Citizen Energy II LLC / Blue Mountain Midstream LLC (Riviera Resources, Inc.) 111 7.1 Jul-20 CNX Resources Corporation / 46.9% stake in CNX Midstream Partners LP 728 7.7 Feb-20 Equitrans Midstream Corporation / EQM Midstream Partners 1,762 8.3 Mean 6.8x Median 7.0 Min 3.0 Max 11.7

Preliminary Valuation of the Common Units Precedent M&A Transaction Analysis (cont’d) ($ in millions) Natural Gas Transportation Transactions Date Transaction EBITDA Announced Acquiror / Target (Seller) Value ($MM) Multiple Dec-22 Williams Companies / MountainWest (Southwest Gas Holdings) $1,500 8.0x Sep-22 DT Midstream / 26.25% Ownership Interest in Millennium Pipeline (National Grid) 552 10.0 Jun-21 Kinder Morgan / Stagecoach Gas Services (Crestwood Equity Partners LP, Consolidated Edison Inc) 857 10.7 Feb-21 ArcLight Capital Partners LLC / 25% Interest in Natural Gas Pipeline Company of America LLC (Kinder Morgan) 1,300 11.2 Jul-20 Berkshire Hathaway Energy / Dominion Energy Natural Gas Transmission and Storage Business 9,700 9.7 Mar-20 ATCO Gas and Pipelines Ltd / Pioneer Pipeline (Tidewater Midstream and Infrastructure Ltd. & TransAlta Corp.) 184 NA Feb-20 Equitrans Midstream Corporation / EQM Midstream Partners, LP 1,762 8.3 Sep-19 NextEra Energy Partners, LP / Meade Pipeline Co LLC 1,280 11.6 Sep-19 Kinder Morgan / Corpus Christi Pipeline Network (Southcross) 76 9.0 Jan-19 NEXUS Gas Transmission, LLC (Enbridge Inc.; DTE Energy Company) / Generation Pipeline LLC 160 14.4 Feb-18 Tallgrass Energy GP, LP / 25.01% interest in Rockies Express Pipeline LLC (Tallgrass Development LP) 1,044 6.4 Nov-17 American Midstream Partners, LP / Trans-Union Interstate Pipeline (ArcLight Capital Partners, LLC) 48 6.5 Jul-17 Blackstone Energy Partners / 32.44% interest in Rover Pipeline (Energy Transfer Partners, LP) 1,571 10.7 TC Pipelines / 49.3% interest in Iroquois Gas Transmission System, LP and 11.8% interest in Portland Natural Gas Transmission (TransCanada Jun-17 765 10.9 Corp.) Apr-17 Tallgrass Energy Partners, LP / 24.99% interest in Rockies Express Pipeline LLC (Tallgrass Development, LP) 1,043 6.6 Mean 9.6x Median 9.9 Min 6.4 Max 14.4 Source: Public filings, FactSet

Preliminary Valuation of the Common Units Precedent M&A Transaction Analysis (cont’d) ($ in millions) NGL and NGL-Related Transportation Transactions Date Transaction EBITDA Announced Acquiror / Target (Seller) Value ($MM) Multiple Jan-23 Targa Resources Corp / 25% interest in Grand Prix Pipeline (Blackstone Energy Partners) $1,050 8.8x Mar-22 ArcLight / 25% Interest in Gulf Coast Express Pipeline (Targa Resources) 857 11.1 Oct-21 Phillips 66 / Phillips 66 Partners 14,400 10.1 Aug-19 Pembina Pipeline Corporation / Cochin Pipeline (Kinder Morgan) 1,546 13.0 Jul-19 Altus Midstream / 33.0% interest in Shin Oak Pipeline (Enterprise Products Partners L.P.) 1,336 13.8 Oct-17 Blackstone Energy Partners / 25% interest in Grand Prix Pipeline (Targa Resources Corp) 325 10.0 Oct-16 Phillips 66 Partners LP / 30 crude oil, refined products and NGL logistics assets (Phillips 66) 1,300 8.7 Jun-16 Riverstone Investment Group LLC / 50% Partner Interest in Utopia Pipeline Project (Kinder Morgan, Inc.) 300 12.0 May-16 Phillips 66 Partners LP / Standish Pipeline and remaining 75% in Phillips 66 Sweeny Frac LLC (Phillips 66) 1,033 8.6 Mean 10.7x Median 10.1 Min 8.6 Max 13.8 Source: Public filings, FactSet

Preliminary Valuation of the Common Units A Precedent M&A Transaction Analysis – EV/EBITDA ($ in millions, except per unit amounts) 2022E Adjusted EBITDA $1,749 Relevant EBITDA Multiple 7.25x—9.25x Implied Enterprise Value Based on 2022E Adjusted EBITDA $12,682—$16,180 Less: Preferred Equity1 (271) Less: Net Debt1 (5,331) Less: Noncontrolling Interests1 (25) Implied Equity Value $7,055—$10,553 DCP Units Outstanding 210 Implied DCP Unit Price Range—2022E EBITDA $33.56—$50.20 1. As of December 31, 2022

Preliminary Valuation of the Common Units Premiums Paid Analysis Premium1 Date 1-Day 20-Day Announced Acquiror / Target Consideration Prior Spot VWAP 07/28/22 PBF Energy, Inc. / PBF Logistics LP Cash/Stock-for-Unit (3.0%) 9.5% 07/25/22 Shell USA, Inc. / Shell Midstream Partners, L.P. Cash-for-Unit 23.0% 23.6% 06/02/22 Hartree Partners, LP / Sprague Resources LP Cash-for-Unit 25.2% 27.0% 05/25/22 Höegh LNG Holdings Ltd / Höegh LNG Partners LP Cash-for-Unit 35.0% 42.2% 05/16/22 Diamondback Energy / Rattler Midstream LP Stock-for-Unit 17.3% 10.3% 04/22/22 Ergon, Inc. / Blueknight Energy Partners, L.P. Cash-for-Unit 51.5% 47.5% 12/20/21 BP p.l.c / BP Midstream Partners LP Stock-for-Unit 10.8% 4.0% 10/27/21 Phillips 66 / Phillips 66 Partners LP Stock-for-Unit 4.8% 6.7% 10/04/21 Stonepeak Infrastructure Partners / Teekay LNG Partners LP Cash-for-Unit 8.3% 5.3% 08/23/21 Landmark Dividend / Landmark Infrastructure Partners LP Cash-for-Unit 38.4% 35.0% 03/05/21 Chevron Corporation / Noble Midstream Partners LP Stock-for-Unit 16.7% 18.0% 12/15/20 TC Energy Corporation / TC PipeLines, LP Stock-for-Unit 19.5% 15.5% 07/27/20 CNX Resources Corporation / CNX Midstream Partners Stock-for-Unit 28.1% 3.9% 02/27/20 Equitrans Midstream Corporation / EQM Midstream Partners, LP Stock-for-Unit (1.5%) (5.6%) 12/17/19 Blackstone Infrastructure Partners / Tallgrass Energy LP Cash-for-Unit 56.4% 33.9% 10/01/19 Brookfield Business Partners L.P. / Teekay Offshore Partners L.P. Cash-for-Unit 28.1% 15.1% 09/16/19 Energy Transfer LP / SemGroup Corporation Cash/Unit-for-Share 65.4% 87.3% 08/21/19 Pembina Pipeline Corporation / Kinder Morgan Canada Limited Share-for-Share 37.7% 34.7% 05/10/19 IFM Investors / Buckeye Partners, L.P. Cash-for-Unit 27.5% 23.8% 05/08/19 MPLX LP / Andeavor (Marathon Petroleum Corporation; Andeavor Logistics LP) Unit-for-Unit 1.8% 1.3% 04/02/19 UGI Corporation / AmeriGas Partners, L.P. Cash/Stock-for-Unit 13.5% 22.2% 03/18/19 ArcLight Energy Partners Fund V, L.P. / American Midstream, LP Cash-for-Unit 31.2% 31.2% 02/05/19 SunCoke Energy, Inc. / SunCoke Energy Partners, L.P. Stock-for-Unit 9.3% 19.5% 11/26/18 ArcLight Energy Partners Fund VI, L.P. / TransMontaigne Partners L.P. Cash-for-Unit 12.6% 9.2% 11/08/18 Western Gas Equity Partners, LP / Western Gas Partners, LP Unit-for-Unit 7.6% 62.4% 10/22/18 EnLink Midstream, LLC / EnLink Midstream Partners, LP Unit-for-Unit 1.1% (0.5%) 10/18/18 Valero Energy Corporation / Valero Energy Partners LP Cash-for-Unit 6.0% 9.4% 10/09/18 Antero Midstream GP LP / Antero Midstream Partners LP Cash/Stock-for-Unit 63.7% 54.6% Min (3.0%) (5.6%) Median 18.4% 18.8% All Transactions Mean 22.7% 23.1% Max 65.4% 87.3% Min 6.0% 5.3% Median 27.8% 25.4% Cash-for-Unit Mean 28.6% 25.3% Max 56.4% 47.5% Source: Bloomberg, FactSet, Public filings VWAP premiums paid are calculated by dividing the value of the offer, defined as the exchange ratio multiplied by the closing price of the acquiror’s shares / units on the last trading day prior to announcement plus any cash received, by the 20-trading day VWAP of the target as calculated from the last undisturbed trading day prior to the announcement

Preliminary Valuation of the Common Units Premiums Paid Analysis (cont’d) For Reference Only Summary Results – Cash-for-Unit Transactions 1-Day Prior Spot 20-Day VWAP Unit Price as of 8/17/22 $34.75 $33.88 Historical Merger Premium Range 6.0% — 56.4% 5.3% — 47.5% Implied DCP Unit Price Range $36.84 — $54.36 $35.67 — $49.97 Merger Premium Selected Range 15.0% 30.0% Median-Implied DCP Unit Value $39.96 $44.05 Source: FactSet

Preliminary Valuation of the Common Units Net Present Value of PSX/DCP Operational Efficiencies ($ in millions, except per unit amounts) For Reference Only For the Years Ending December 31, Terminal 2023E 2024E 2025E 2026E 2027E Value Net Operational Efficiencies ($34) $93 $93 $93 $93 $93 Terminal Multiple 8.0x Implied Terminal Value $744 Present Value of Terminal Value @ 13.0% Discount Rate $404 Plus: Present Value of Unlevered Free Cash Flow @ 13.0% Discount Rate 229 Implied NPV of Operational Efficiencies $633 DCP Units Outstanding1 210 Implied Value per Unit $3.01 Value Per NPV of Operational Efficiencies Based on a Range of Discount Rates NPV DCP Unit Present Value @ 10.0% Discount Rate $711 $3.38 Present Value @ 11.0% Discount Rate 684 3.25 Present Value @ 12.0% Discount Rate 657 3.13 Present Value @ 13.0% Discount Rate 633 3.01 Present Value @ 14.0% Discount Rate 609 2.90 Present Value @ 15.0% Discount Rate 586 2.79 Source: DCP Management 1. Includes 117.8mm common units held by DCP Midstream, LLC and DCP Midstream GP, LP, and 1.8mm phantom and performance units

Appendix

A. Weighted Average Cost of Capital Analysis

Weighted Average Cost of Capital Analysis DCP Common Units – Capital Asset Pricing Model ($ in millions, except per unit/share amounts) Unit/Share Price Market Equity Total Debt and Total Debt / Adjusted Unlevered 1/4/23 Value Preferred Equity Capitalization Beta 1 2 Partnership/Corporation Total Beta Antero Midstream Corporation $10.89 $5,269 $3,370 39.0% 0.81 0.54 Crestwood Equity Partners LP 26.56 2,859 4,182 59.4% 0.63 0.31 EnLink Midstream, LLC 11.95 5,788 4,579 44.2% 0.99 0.61 Equitrans Midstream Corporation 6.85 2,997 7,014 70.1% 0.94 0.33 Hess Midstream Partners LP 30.02 7,205 2,909 28.8% 0.76 0.59 Kinetik Holdings Inc. 31.53 4,331 3,448 44.3% 0.73 0.45 CAPM ONEOK, Inc. 64.44 28,915 12,876 30.8% 1.04 0.77 Summit Midstream Partners, LP 16.51 174 1,728 90.9% 0.91 0.11 Targa Resources Corp. 71.03 16,403 13,210 44.6% 0.92 0.56 Western Midstream Partners, LP 25.89 10,267 7,095 40.9% 0.90 0.60 Mean 49.3% 0.86 0.49 Median 44.2% 0.90 0.55 DCP Midstream, LP $38.59 $8,066 $5,584 40.9% 0.73 0.49 Risk-free Rate 3 4.0% Unlevered Beta 0.49 Debt and Preferred / Total Capitalization 40.9% Adjusted Levered Equity Beta 0.73 DCP Midstream Cost of Debt7 Supply-Side MRP Historical MRP 4 Yield-to-Worst WACC Market Risk Premium (“MRP”) 6.2% 7.5% Small Company Risk Premium 5 0.7% DCP Midstream 5.600% Senior Notes Due 2044 6.10% Equity Cost of Capital 6 9.2% 10.1% U.S. Treasury Note Due 2042 3.97% 7 5.9% Less: U.S. Treasury Note Due 2044 4.13% Pre-Tax Cost of Debt (0.16%) After-Tax Cost of Debt 8 4.2% WACC 7.2% 7.7% DCP Midstream Implied 20-Year Cost of Debt 5.94% Equity Cost of Capital Sensitivity WACC Sensitivity (Supply-Side / Historical) (Supply-Side / Historical) Debt and Preferred / Total Capitalization Debt and Preferred / Total Capitalization 45.0% 50.0% 55.0% 60.0% 65.0% 45.0% 50.0% 55.0% 60.0% 65.0% ed 0.45 6.9% / 7.4% 6.8% / 7.3% 6.8% / 7.2% 6.7% / 7.1% 6.6% / 7.1% ed 0.45 9.1% / 10.0% 9.4% / 10.4% 9.9% / 10.9% 10.4% / 11.6% 11.1% / 12.4% r 0.50 7.2% / 7.7% 7.1% / 7.6% 7.0% / 7.5% 6.9% / 7.5% 6.9% / 7.4% r 0.50 9.6% / 10.6% 10.0% / 11.0% 10.5% / 11.6% 11.1% / 12.3% 11.9% / 13.3% Beta 0.55 7.4% / 8.0% 7.3% / 7.9% 7.3% / 7.8% 7.2% / 7.8% 7.1% / 7.7% Beta 0.55 10.1% / 11.1% 10.5% / 11.7% 11.0% / 12.3% 11.7% / 13.1% 12.6% / 14.1% nleve U 0.60 7.7% / 8.3% 7.6% / 8.2% 7.5% / 8.2% 7.5% / 8.1% 7.4% / 8.0% U nleve 0.60 10.6% / 11.7% 11.0% / 12.3% 11.6% / 13.0% 12.4% / 13.9% 13.3% / 15.0% 0.65 8.0% / 8.7% 7.9% / 8.6% 7.8% / 8.5% 7.7% / 8.4% 7.6% / 8.3% 0.65 11.1% / 12.3% 11.6% / 12.9% 12.2% / 13.7% 13.0% / 14.6% 14.0% / 15.9% 1. Source: Predicted raw betas from FactSet; Adjusted Equity Beta calculated as: (0.67) × Raw Beta +(0.33) × 1.0 2. Unlevered Beta calculated as: Adjusted Equity Beta × (E/(E + D × (1-T)); Assumes corporate tax rate of 29.6% for partnerships and 21.0% for corporations 3. 20-year Treasury as of January 4, 2023 4. Source: Duff & Phelps 5. Decile: Mid Cap (5) with equity value range of $6,743.4 million to $13,177.8 million 6. Equity Cost of Capital calculated as: Risk-free rate + (Levered Equity Beta × Market Risk Premium) + Small Company Risk Premium 7. Implied DCP 20-year cost of debt based on the yield-to-worst of DCP’s 5.600% Senior Notes Due 2044 adjusted for 20-year maturity using the implied yield spread from relevant U.S. treasury notes 8. Assumes U.S. individual partnership income tax structure through 2025 of 80.0% of income taxable at highest tax rate of 37.0%, or 29.6%

Weighted Average Cost of Capital Analysis DCP Common Units – Total Expected Market Return ($ in millions, except per unit/share amounts) Unit/Share Price Market Equity Distribution/Dividend Total Partnership/Corporation 1/4/23 Value Current Yield Growth Return Antero Midstream Corporation $10.89 $5,269 8.3% —% 8.3% Crestwood Equity Partners LP 26.56 2,859 9.9% 3.7% 13.6% EnLink Midstream, LLC 11.95 5,788 3.8% 10.0% 13.8% Equitrans Midstream Corporation 6.85 2,997 8.8% 0.8% 9.6% Total Hess Midstream Partners LP 30.02 7,205 7.5% 4.0% 11.5% Expected Kinetik Holdings Inc. 31.53 4,331 9.5% 4.3% 13.8% Market ONEOK, Inc. 64.44 28,915 5.8% 4.0% 9.8% Return Targa Resources Corp. 71.03 16,403 2.0% 10.0% 12.0% Western Midstream Partners, LP 25.89 10,267 7.7% 10.9% 18.7% Mean 12.3% Median 12.0% DCP Midstream, LP $38.59 $8,066 4.5% 3.1% 7.6% WACC Debt and Preferred / Total Capitalization 40.9% Market Required Equity Return 12.0% WACC Pre-Tax Cost of Debt1 5.9% After-Tax Cost of Debt2 4.2% DCP Cost of Debt1 WACC 8.8% Yield-to-Worst DCP Midstream 5.600% Senior Notes Due 2044 6.10% U.S. Treasury Note Due 2042 3.97% Less: U.S. Treasury Note Due 2044 4.13% (0.16%) DCP Midstream Implied 20-Year Cost of Debt 5.94% 1. Implied DCP 20-year cost of debt based on the yield-to-worst of DCP’s 5.600% Senior Notes Due 2044 Adjusted for 20-year maturity using the implied yield spread from relevant U.S. treasury notes 2. Assumes U.S. individual partnership income tax structure through 2025 of 80.0% of income taxable at highest tax rate of 37.0%, or 29.6%

B. Supplemental Valuation Materials

B Sensitivity Case B – NYMEX Strip Pricing

Supplemental Valuation Materials – NYMEX Strip Pricing B Discounted Cash Flow Analysis ($ in millions, except per unit amounts) Summary Results For the Years Ending December 31, Exit Perpetuity 2023E 2024E 2025E 2026E 2027E Multiple Growth Adjusted EBITDA $1,583 $1,581 $1,555 $1,534 $1,518 $1,518 $1,518 Less: Tax Depreciation and Amortization¹ (14,678) (154) (127) (118) (116) (125) EBIT ($13,096) $1,428 $1,428 $1,415 $1,402 $1,393 Less: Cash Taxes — (85) (85) (105) (104) (515) EBIAT ($13,096) $1,343 $1,343 $1,311 $1,299 $877 Plus: Tax Depreciation and Amortization 14,678 154 127 118 116 125 Less: Maintenance Capex (150) (150) (125) (125) (125) (125) Less: Growth Capex (125) (50) (50) (50) (50) —Unlevered Free Cash Flow $1,308 $1,297 $1,295 $1,254 $1,239 $877 EBITDA Multiple / Perpetuity Growth Rate 8.5x 1.0% Implied Terminal Value $12,901 $13,634 Present Value of Terminal Value @ 7.5% Discount Rate $8,986 $9,160 Plus: Present Value of Unlevered Free Cash Flow @ 7.5% Discount Rate 5,374 Implied Enterprise Value $14,361 $14,534 Less: Preferred Equity2 ($271) Less: Net Debt2 (5,331) Less: Noncontrolling Interests2 (25) Implied Equity Value $8,734 $8,907 DCP Units Outstanding3 210 Implied Value per Unit $41.54 $42.37 Sensitivity Analysis Terminal Exit Multiple Perpetuity Growth Rate 7.5x 8.0x 8.5x 9.0x 9.5x —% 0.5% 1.0% 1.5% 2.0% 6.5% $38.88 $41.52 $44.15 $46.79 $49.42 6.5% $44.77 $48.81 $53.57 $59.28 $66.27 7.0% 37.68 40.26 42.83 45.40 47.98 7.0% 40.17 43.56 47.50 52.17 57.76 WACC 7.5% 36.51 39.03 41.54 44.06 46.57 WACC 7.5% 36.18 39.05 42.37 46.23 50.80 8.0% 35.37 37.83 40.29 42.74 45.20 8.0% 32.69 35.15 37.96 41.20 44.99 8.5% 34.26 36.66 39.06 41.47 43.87 8.5% 29.60 31.73 34.14 36.89 40.07 47 1. 2023E tax DD&A assumes 80% bonus depreciation calculated as the midpoint of the enterprise value range plus 2023E capital expenditures 2. Per DCP Management as of December 31, 2022 3. Includes 117.8mm common units held by DCP Midstream, LLC and DCP Midstream GP, LP, and 1.8mm phantom and performance units

Supplemental Valuation Materials – NYMEX Strip Pricing B Peer Group Trading Analysis – EV/EBITDA ($ in millions, except per unit amounts) 2023E Adjusted EBITDA $1,583 Relevant EBITDA Multiple 8.0x—9.0x Implied Enterprise Value Based on 2023E Adjusted EBITDA $12,661—$14,244 Less: Preferred Equity1 (271) Less: Net Debt1 (5,331) Less: Noncontrolling Interests1 (25) Implied Equity Value $7,034—$8,617 DCP Units Outstanding 210 Implied DCP Unit Price Range—2023E EBITDA $33.46—$40.99 2024E Adjusted EBITDA $1,581 Relevant EBITDA Multiple 8.0x—9.0x Implied Enterprise Value Based on 2024E Adjusted EBITDA $12,651—$14,232 Less: Preferred Equity1 (271) Less: Net Debt1 (5,331) Less: Noncontrolling Interests1 (25) Implied Equity Value $7,024—$8,605 DCP Units Outstanding 210 Implied DCP Unit Price Range—2024E EBITDA $33.41—$40.93 Implied DCP Unit Price Range—2023E and 2024E EBITDA $33.41—$40.99 1. As of December 31, 2022

Supplemental Valuation Materials – NYMEX Strip Pricing B Peer Group Trading Analysis – Price/DCF per LP Unit ($ in millions, except per unit amounts) 2023E DCF / LP Unit $5.34 Relevant Multiple 6.5x—7.5x Implied DCP Unit Price Range—2023E Price / DCF $34.73—$40.08 2024E DCF / LP Unit $5.55 Relevant Multiple 6.0x—7.0x Implied DCP Unit Price Range—2024E Price / DCF $33.30—$38.85 Implied DCP Unit Price Range—2023E and 2024E Price / DCF $33.30—$40.08

Supplemental Valuation Materials – NYMEX Strip Pricing B Precedent M&A Transaction Analysis – EV/EBITDA ($ in millions, except per unit amounts) 2022E Adjusted EBITDA $1,749 Relevant EBITDA Multiple 7.25x—9.25x Implied Enterprise Value Based on 2022E Adjusted EBITDA $12,682—$16,180 Less: Preferred Equity1 (271) Less: Net Debt1 (5,331) Less: Noncontrolling Interests1 (25) Implied Equity Value $7,055—$10,553 DCP Units Outstanding 210 Implied DCP Unit Price Range—2022E EBITDA $33.56—$50.20 1. As of December 31, 2022

C Sensitivity Case C – Higher Commodity Prices

DCP Financial Projections – Higher Commodity Prices C DCP Financial Projections ($ in millions) For the Years Ending December 31, 2022E-2027E 2022E 2023E 2024E 2025E 2026E 2027E CAGR Gathering & Processing Segment North Region $1,075 $1,005 $884 $890 $878 $867 (4.2%) South Region 190 162 147 144 143 142 (5.7%) Midcontinent Region 275 254 232 222 221 220 (4.4%) Permian Region 572 612 577 557 555 552 (0.7%) Other G&P -——————- Total Gathering & Processing Gross Margin $2,112 $2,033 $1,839 $1,812 $1,796 $1,780 (3.4%) Total Costs North Region ($157) ($144) ($154) ($154) ($156) ($158) 0.2% South Region (99) (99) (92) (92) (94) (95) (0.8%) Midcontinent Region (165) (162) (174) (174) (177) (179) 1.6% Permian Region (251) (293) (307) (308) (312) (317) 4.7% Other G&P (19) (23) (20) (21) (21) (21) 2.6% Total Gathering & Processing Costs ($691) ($721) ($748) ($748) ($760) ($771) 2.2% Total Gathering & Processing Segment Margin $1,421 $1,312 $1,091 $1,064 $1,037 $1,010 (6.6%) Logistics & Marketing Segment Southern Hills + Sand Hills $429 $436 $442 $449 $449 $449 0.9% Other NGL Pipelines 141 149 156 158 158 158 2.3% NGL Marketing + Storage 46 49 39 39 39 39 (3.2%) Downstream Fractionation 19 21 21 21 21 21 2.0% Gas Marketing + Other Income 18 13 13 13 13 13 (7.1%) Gas Storage 2 13 12 12 12 12 43.2% Guadalupe 62 48 40 40 40 40 (8.5%) Gulf Coast Express Equity Earnings 66 66 66 66 66 66 (0.0%) Cheyenne Connector Equity Earnings 14 14 14 14 14 14 0.0% Total Logistics & Marketing Gross Margin $798 $810 $804 $812 $812 $812 0.4% Total Costs Logistics & Marketing Costs ($44) ($47) ($41) ($41) ($42) ($42) (0.9%) Total Logistics & Marketing Segment Margin $754 $763 $763 $771 $771 $770 0.4% Source: DCP Management

DCP Financial Projections – Higher Commodity Prices C DCP Financial Projections – Summary Cash Flows ($ in millions, except per unit amounts) For the Years Ending December 31, 2022E-2027E 2022E 2023E 2024E 2025E 2026E 2027E CAGR Gathering & Processing Segment Margin $1,421 $1,312 $1,091 $1,064 $1,037 $1,010 (6.6%) Logistics & Marketing Segment Margin 754 763 763 771 771 770 0.4% Less: Corporate Costs (255) (257) (236) (236) (239) (243) (1.0%) Plus: Adj. Distribution in Excess of Equity Earnings—Logistics 77 80 80 80 80 80 0.9% Plus: Adj. Distribution in Excess of Equity Earnings—Discovery 13 9 9 9 9 9 (7.3%) Plus: Hedge settlement (294) (47) (8) (8) -—- Adjusted EBITDA $1,717 $1,860 $1,700 $1,681 $1,657 $1,626 (1.1%) Plus: Growth Projects -—- 18 25 32 39 Total Adjusted EBITDA $1,717 $1,860 $1,718 $1,706 $1,690 $1,666 (0.6%) Less: Interest Expense ($273) ($282) ($256) ($220) ($210) ($183) Less: Preferred Securities (58) (15) -———-Less: Sustaining Capital (135) (150) (150) (125) (125) (125) Less: Income Taxes (5) (5) (5) (5) (5) (5) Less: Other (3) (7) (7) (5) (5) (5) Distributable Cash Flow $1,242 $1,401 $1,300 $1,351 $1,344 $1,347 1.6% Identified Organic Capital ($140) $— $— $— $— $—Unidentified Organic Capital — (125) (50) (50) (50) (50) Acquisition Capital (160) -————- Distributions (342) (359) (359) (359) (359) (359) 1.0% Working Capital and Interest Timing (30) 133 90 -——- Cash Surplus / (Shortfall) $570 $1,050 $981 $942 $935 $938 10.5% LP Units Outstanding 208 209 209 209 209 209 0.0% Distributable Cash Flow per LP Unit $5.96 $6.71 $6.23 $6.47 $6.44 $6.46 1.6% Distribution per Unit 1.68 1.72 1.72 1.72 1.72 1.72 0.5% Total Distributions $342 $359 $359 $359 $359 $359 1.0% Source: DCP Management 52

DCP Financial Projections – Higher Commodity Prices C DCP Financial Projections – Sources and Uses ($ in millions) For the Years Ending December 31, 2022E 2023E 2024E 2025E 2026E 2027E Sources DCF Surplus / (Shortfall) $570 $1,050 $981 $942 $935 $938 Revolver Draw 279 -————- Total Sources $849 $1,050 $981 $942 $935 $938 Uses Revolver Paydown $— $279 $260 $— $— $— Long-Term Debt Paydown 350 500 — 825 — 500 Preferred Equity Redemption 500 271 -———-Cash Balance Increase / (Decrease) (1) — 720 117 935 438 Total Uses $849 $1,050 $981 $942 $935 $938 Memo: Cash $— $— $720 $837 $1,772 $2,211 Total Debt 5,364 4,585 4,325 3,500 3,500 3,000 Net Debt $5,364 $4,585 $3,605 $2,663 $1,728 $789 Preferred Equity 271 -————- Net Debt + Preferred Equity $5,635 $4,585 $3,605 $2,663 $1,728 $789 Total Debt / Adjusted EBITDA 3.1x 2.5x 2.5x 2.1x 2.1x 1.8x Net Debt / Adjusted EBITDA 3.1 2.5 2.1 1.6 1.0 0.5 (Net Debt + Preferred Equity) / Adjusted EBITDA 3.3 2.5 2.1 1.6 1.0 0.5 Source: DCP Management 53

Supplemental Valuation Materials – Higher Commodity Prices C Discounted Cash Flow Analysis ($ in millions, except per unit amounts) Summary Results For the Years Ending December 31, Exit Perpetuity 2023E 2024E 2025E 2026E 2027E Multiple Growth Adjusted EBITDA $1,860 $1,718 $1,706 $1,690 $1,666 $1,666 $1,666 Less: Tax Depreciation and Amortization¹ (16,314) (154) (127) (118) (116) (125) EBIT ($14,455) $1,564 $1,579 $1,571 $1,550 $1,541 Less: Cash Taxes — (93) (93) (116) (115) (570) EBIAT ($14,455) $1,472 $1,486 $1,455 $1,435 $971 Plus: Tax Depreciation and Amortization 16,314 154 127 118 116 125 Less: Maintenance Capex (150) (150) (125) (125) (125) (125) Less: Growth Capex (125) (50) (50) (50) (50) —Unlevered Free Cash Flow $1,585 $1,425 $1,438 $1,398 $1,376 $971 EBITDA Multiple / Perpetuity Growth Rate 8.5x 1.0% Implied Terminal Value $14,158 $15,082 Present Value of Terminal Value @ 7.5% Discount Rate $9,862 $10,132 Plus: Present Value of Unlevered Free Cash Flow @ 7.5% Discount Rate 6,087 Implied Enterprise Value $15,948 $16,219 Less: Preferred Equity2 ($271) Less: Net Debt2 (5,364) Less: Noncontrolling Interests2 (25) Implied Equity Value $10,288 $10,559 DCP Units Outstanding3 210 Implied Value per Unit $48.94 $50.22 Sensitivity Analysis Terminal Exit Multiple Perpetuity Growth Rate 7.5x 8.0x 8.5x 9.0x 9.5x —% 0.5% 1.0% 1.5% 2.0% 6.5% $46.03 $48.92 $51.81 $54.70 $57.59 6.5% $52.89 $57.35 $62.62 $68.94 $76.67 C C 7.0% 44.71 47.53 50.35 53.18 56.00 C C 7.0% 47.80 51.54 55.91 61.07 67.26 WA 7.5% 43.42 46.18 48.94 51.70 54.45 WA 7.5% 43.38 46.56 50.22 54.50 59.55 8.0% 42.16 44.86 47.55 50.25 52.95 8.0% 39.52 42.24 45.35 48.93 53.12 8.5% 40.94 43.57 46.21 48.84 51.48 8.5% 36.10 38.45 41.12 44.16 47.68 54 1. 2023E tax DD&A assumes 80% bonus depreciation calculated as the midpoint of the enterprise value range plus 2023E capital expenditures 2. Per DCP Management as of December 31, 2022 3. Includes 117.8mm common units held by DCP Midstream, LLC and DCP Midstream GP, LP, and 1.8mm phantom and performance units

Supplemental Valuation Materials – Higher Commodity Prices C Peer Group Trading Analysis – EV/EBITDA ($ in millions, except per unit amounts) 2023E Adjusted EBITDA $1,860 Relevant EBITDA Multiple 8.0x—9.0x Implied Enterprise Value Based on 2023E Adjusted EBITDA $14,880—$16,740 Less: Preferred Equity1 (271) Less: Net Debt1 (5,364) Less: Noncontrolling Interests1 (25) Implied Equity Value $9,220—$11,080 DCP Units Outstanding 210 Implied DCP Unit Price Range—2023E EBITDA $43.85—$52.70 2024E Adjusted EBITDA $1,718 Relevant EBITDA Multiple 8.0x—9.0x Implied Enterprise Value Based on 2024E Adjusted EBITDA $13,742—$15,459 Less: Preferred Equity1 (271) Less: Net Debt1 (5,364) Less: Noncontrolling Interests1 (25) Implied Equity Value $8,082—$9,799 DCP Units Outstanding 210 Implied DCP Unit Price Range—2024E EBITDA $38.44—$46.61 Implied DCP Unit Price Range—2023E and 2024E EBITDA $38.44—$52.70 1. As of December 31, 2022 55

Supplemental Valuation Materials – Higher Commodity Prices C Peer Group Trading Analysis – Price/DCF per LP Unit ($ in millions, except per unit amounts) 2023E DCF / LP Unit $6.71 Relevant Multiple 6.5x—7.5x Implied DCP Unit Price Range—2023E Price / DCF $43.62—$50.33 2024E DCF / LP Unit $6.23 Relevant Multiple 6.0x—7.0x Implied DCP Unit Price Range—2024E Price / DCF $37.36—$43.59 Implied DCP Unit Price Range—2023E and 2024E Price / DCF $37.36—$50.33 56

Supplemental Valuation Materials – Higher Commodity Prices C Precedent M&A Transaction Analysis – EV/EBITDA ($ in millions, except per unit amounts) 2022E Adjusted EBITDA $1,717 Relevant EBITDA Multiple 7.25x—9.25x Implied Enterprise Value Based on 2022E Adjusted EBITDA $12,446—$15,879 Less: Preferred Equity1 (271) Less: Net Debt1 (5,364) Less: Noncontrolling Interests1 (25) Implied Equity Value $6,785—$10,219 DCP Units Outstanding 210 Implied DCP Unit Price Range—2022E EBITDA $32.28—$48.61 1. As of December 31, 2022 57

D Sensitivity Case D – Lower Commodity Prices

DCP Financial Projections – Lower Commodity Prices D DCP Financial Projections ($ in millions) For the Years Ending December 31, 2022E-2027E 2022E 2023E 2024E 2025E 2026E 2027E CAGR Gathering & Processing Segment North Region $1,075 $478 $397 $414 $414 $414 (17.4%) South Region 190 127 115 113 113 113 (9.9%) Midcontinent Region 275 222 209 201 201 201 (6.1%) Permian Region 572 487 487 469 469 469 (3.9%) Other G&P -——————- Total Gathering & Processing Gross Margin $2,112 $1,314 $1,208 $1,197 $1,197 $1,197 (10.7%) Total Costs North Region ($157) ($144) ($154) ($154) ($156) ($158) 0.2% South Region (99) (99) (92) (92) (94) (95) (0.8%) Midcontinent Region (165) (162) (174) (174) (177) (179) 1.6% Permian Region (251) (293) (307) (308) (312) (317) 4.7% Other G&P (19) (23) (20) (21) (21) (21) 2.6% Total Gathering & Processing Costs ($691) ($721) ($748) ($748) ($760) ($771) 2.2% Total Gathering & Processing Segment Margin $1,421 $593 $460 $449 $437 $426 (21.4%) Logistics & Marketing Segment Southern Hills + Sand Hills $429 $436 $442 $449 $449 $449 0.9% Other NGL Pipelines 141 149 156 158 158 158 2.3% NGL Marketing + Storage 46 49 39 39 39 39 (3.2%) Downstream Fractionation 19 21 21 21 21 21 2.0% Gas Marketing + Other Income 18 13 13 13 13 13 (7.1%) Gas Storage 2 13 12 12 12 12 43.2% Guadalupe 62 48 40 40 40 40 (8.5%) Gulf Coast Express Equity Earnings 66 66 66 66 66 66 (0.0%) Cheyenne Connector Equity Earnings 14 14 14 14 14 14 0.0% Total Logistics & Marketing Gross Margin $798 $810 $804 $812 $812 $812 0.4% Total Costs Logistics & Marketing Costs ($44) ($47) ($41) ($41) ($42) ($42) (0.9%) Total Logistics & Marketing Segment Margin $754 $763 $763 $771 $771 $770 0.4% Source: DCP Management 58

DCP Financial Projections – Lower Commodity Prices D DCP Financial Projections – Summary Cash Flows ($ in millions, except per unit amounts) For the Years Ending December 31, 2022E-2027E 2022E 2023E 2024E 2025E 2026E 2027E CAGR Gathering & Processing Segment Margin $1,421 $593 $460 $449 $437 $426 (21.4%) Logistics & Marketing Segment Margin 754 763 763 771 771 770 0.4% Less: Corporate Costs (255) (257) (236) (236) (239) (243) (1.0%) Plus: Adj. Distribution in Excess of Equity Earnings—Logistics 77 80 80 80 80 80 0.9% Plus: Adj. Distribution in Excess of Equity Earnings—Discovery 13 9 9 9 9 9 (7.3%) Plus: Hedge settlement (294) 112 42 13 -—- Adjusted EBITDA $1,717 $1,300 $1,118 $1,087 $1,058 $1,043 (9.5%) Plus: Growth Projects -—- 18 25 32 39 Total Adjusted EBITDA $1,717 $1,300 $1,136 $1,112 $1,090 $1,082 (8.8%) Less: Interest Expense ($273) ($302) ($286) ($262) ($247) ($229) Less: Preferred Securities (58) (15) -———-Less: Sustaining Capital (135) (150) (150) (125) (125) (125) Less: Income Taxes (5) (5) (5) (5) (5) (5) Less: Other (3) (7) (7) (5) (5) (5) Distributable Cash Flow $1,242 $822 $688 $715 $708 $718 (10.4%) Identified Organic Capital ($140) $— $— $— $— $—Unidentified Organic Capital — (125) (50) (50) (50) (50) Acquisition Capital (160) -————- Distributions (342) (359) (359) (359) (359) (359) 1.0% Working Capital and Interest Timing (30) 133 90 -——- Cash Surplus / (Shortfall) $570 $471 $369 $306 $299 $309 (11.5%) LP Units Outstanding 208 209 209 209 209 209 0.0% Distributable Cash Flow per LP Unit $5.96 $3.94 $3.30 $3.43 $3.39 $3.44 (10.4%) Distribution per Unit 1.68 1.72 1.72 1.72 1.72 1.72 0.5% Total Distributions $342 $359 $359 $359 $359 $359 1.0% Source: DCP Management 59

DCP Financial Projections – Lower Commodity Prices D DCP Financial Projections – Sources and Uses ($ in millions) For the Years Ending December 31, 2022E 2023E 2024E 2025E 2026E 2027E Sources DCF Surplus / (Shortfall) $570 $471 $369 $306 $299 $309 Revolver Draw 279 300 — 519 — 191 Total Sources $849 $771 $369 $825 $299 $500 Uses Revolver Paydown $— $— $369 $— $299 $— Long-Term Debt Paydown 350 500 — 825 — 500 Preferred Equity Redemption 500 271 -———-Cash Balance Increase / (Decrease) (1) -————- Total Uses $849 $771 $369 $825 $299 $500 Memo: Cash $— $— $— $— $— $— Total Debt 5,364 5,164 4,795 4,489 4,190 3,881 Net Debt $5,364 $5,164 $4,795 $4,489 $4,190 $3,881 Preferred Equity 271 -————- Net Debt + Preferred Equity $5,635 $5,164 $4,795 $4,489 $4,190 $3,881 Total Debt / Adjusted EBITDA 3.1x 4.0x 4.2x 4.0x 3.8x 3.6x Net Debt / Adjusted EBITDA 3.1 4.0 4.2 4.0 3.8 3.6 (Net Debt + Preferred Equity) / Adjusted EBITDA 3.3 4.0 4.2 4.0 3.8 3.6 Source: DCP Management 60

Supplemental Valuation Materials – Lower Commodity Prices D Discounted Cash Flow Analysis ($ in millions, except per unit amounts) Summary Results For the Years Ending December 31, Exit Perpetuity 2023E 2024E 2025E 2026E 2027E Multiple Growth Adjusted EBITDA $1,300 $1,136 $1,112 $1,090 $1,082 $1,082 $1,082 Less: Tax Depreciation and Amortization¹ (10,350) (154) (127) (118) (116) (125) EBIT ($9,050) $983 $984 $972 $967 $957 Less: Cash Taxes — (58) (58) (72) (72) (354) EBIAT ($9,050) $924 $926 $900 $895 $603 Plus: Tax Depreciation and Amortization 10,350 154 127 118 116 125 Less: Maintenance Capex (150) (150) (125) (125) (125) (125) Less: Growth Capex (125) (50) (50) (50) (50) —Unlevered Free Cash Flow $1,025 $878 $878 $843 $836 $603 EBITDA Multiple / Perpetuity Growth Rate 8.5x 1.0% Implied Terminal Value $9,199 $9,370 Present Value of Terminal Value @ 7.5% Discount Rate $6,407 $6,295 Plus: Present Value of Unlevered Free Cash Flow @ 7.5% Discount Rate 3,768 Implied Enterprise Value $10,175 $10,063 Less: Preferred Equity2 ($271) Less: Net Debt2 (5,364) Less: Noncontrolling Interests2 (25) Implied Equity Value $4,515 $4,403 DCP Units Outstanding3 210 Implied Value per Unit $21.48 $20.94 Sensitivity Analysis Terminal Exit Multiple Perpetuity Growth Rate 7.5x 8.0x 8.5x 9.0x 9.5x —% 0.5% 1.0% 1.5% 2.0% 6.5% $19.56 $21.44 $23.32 $25.20 $27.08 6.5% $22.59 $25.36 $28.64 $32.57 $37.37 C C 7.0% 18.72 20.55 22.39 24.22 26.06 C C 7.0% 19.43 21.76 24.47 27.68 31.52 WA 7.5% 17.89 19.68 21.48 23.27 25.06 WA 7.5% 16.69 18.67 20.94 23.60 26.74 8.0% 17.09 18.84 20.59 22.34 24.09 8.0% 14.29 15.98 17.92 20.15 22.75 8.5% 16.30 18.02 19.73 21.44 23.15 8.5% 12.17 13.64 15.29 17.18 19.37 61 1. 2023E tax DD&A assumes 80% bonus depreciation calculated as the midpoint of the enterprise value range plus 2023E capital expenditures 2. Per DCP Management as of December 31, 2022 3. Includes 117.8mm common units held by DCP Midstream, LLC and DCP Midstream GP, LP, and 1.8mm phantom and performance units

Supplemental Valuation Materials – Lower Commodity Prices D Peer Group Trading Analysis – EV/EBITDA ($ in millions, except per unit amounts) 2023E Adjusted EBITDA $1,300 Relevant EBITDA Multiple 8.0x—9.0x Implied Enterprise Value Based on 2023E Adjusted EBITDA $10,404—$11,704 Less: Preferred Equity1 (271) Less: Net Debt1 (5,364) Less: Noncontrolling Interests1 (25) Implied Equity Value $4,744—$6,044 DCP Units Outstanding 210 Implied DCP Unit Price Range—2023E EBITDA $22.56—$28.75 2024E Adjusted EBITDA $1,136 Relevant EBITDA Multiple 8.0x—9.0x Implied Enterprise Value Based on 2024E Adjusted EBITDA $9,090—$10,226 Less: Preferred Equity1 (271) Less: Net Debt1 (5,364) Less: Noncontrolling Interests1 (25) Implied Equity Value $3,430—$4,566 DCP Units Outstanding 210 Implied DCP Unit Price Range—2024E EBITDA $16.31—$21.72 Implied DCP Unit Price Range—2023E and 2024E EBITDA $16.31—$28.75 1. As of December 31, 2022 62

Supplemental Valuation Materials – Lower Commodity Prices D Peer Group Trading Analysis – Price/DCF per LP Unit ($ in millions, except per unit amounts) 2023E DCF / LP Unit $3.94 Relevant Multiple 6.5x—7.5x Implied DCP Unit Price Range—2023E Price / DCF $25.59—$29.52 2024E DCF / LP Unit $3.30 Relevant Multiple 6.0x—7.0x Implied DCP Unit Price Range—2024E Price / DCF $19.79—$23.09 Implied DCP Unit Price Range—2023E and 2024E Price / DCF $19.79—$29.52 63

Supplemental Valuation Materials – Lower Commodity Prices D Precedent M&A Transaction Analysis – EV/EBITDA ($ in millions, except per unit amounts) 2022E Adjusted EBITDA $1,717 Relevant EBITDA Multiple 7.25x—9.25x Implied Enterprise Value Based on 2022E Adjusted EBITDA $12,446—$15,879 Less: Preferred Equity1 (271) Less: Net Debt1 (5,364) Less: Noncontrolling Interests1 (25) Implied Equity Value $6,785—$10,219 DCP Units Outstanding 210 Implied DCP Unit Price Range—2022E EBITDA $32.28—$48.61 1. As of December 31, 2022 64

C. LPG Market Overview

LPG Market Overview Overview Gulf Coast LPG Export Market â—¼ Global Demand: Significant and persistent global demand Permian Basin NGL Pipelines to Gulf Coast Market for LPGs is primarily driven by Asian markets, which lack both local petroleum feedstock and local refining and/or 3,700 processing infrastructure 3,200 â—¼ U.S. Surplus: Rapid growth in U.S. domestic oil and gas 2,700 production has resulted in LPGs exceeding domestic MBpd demand with domestic demand for LPGs remaining relatively 2,200 flat over the past two decades and projected to remain 1,700 relatively flat over the near-to-medium term 1,200 â—¼ Gulf Coast Infrastructure: Several major expansions of Q4 Q1 Q2 Q3 Q4 Q1 Q2 Q3 Q4 Q1 Q2 Q3 Q4 Q1 Q2 Q3 Q4 LPG export capacity are underway to accommodate the 2018 2019 2020 2021 2022E anticipated long-term eastward flows of global LPG trade Existing Capacity Sand Hills Shin Oak â—¼ Fungibility: DCP delivers significant NGL volumes primarily Grand Prix West TX LPG EPIC NGL Lone Star NGL Express to Mont Belvieu, the primary hub for both domestic and exported LPGs U.S. Domestic LPG Supply and Demand Balance 4.00 3.58 — 3.58 3.64 — 3.64 3.41 (0.03) 3.38 0.63 0.63 3.00 0.62 (MMBpd) 1.79 1.78 1.79 e 2.00 n c ala 2.79 2.96 3.01 b 1.00 1.85 LPG 1.59 1.80 US —Production Stocks Demand Production Stocks Demand Production Stocks Demand 2022E 2023E 2024E Gas plant Refinery Exports Domestic demand Source: Wall Street Research 65

LPG Market Overview Texas Fractionation Overview Texas NGL Fractionation Capacity 5,500 5,000 4,500 MBpd 4,000 3,500 ` 3,000 Q1 Q2 Q3 Q4 Q1 Q2 Q3 Q4 Q1 Q2 Q3 Q4 Q1 Q2 Q3 Q4 Q1 Q2 Q3 Q4 2019 2020 2021 2022E 2023E Existing Capacity Energy Transfer ONEOK Enterprise Targa EPIC Philips 66 U.S. Gulf Coast Capacity Additions 350 300 300 250 200 150 125 150 150 150 125 150 150 110 110 110 110 Bp d 100 M 50 —Energy Targa Frac 6 ONEOK Frac4 Enterprise Energy Targa Frac 7 Enterprise Targa Frac 8 ONEOK Frac5 EPIC Frac 1 Phillips 66 Phillips 66 Transfer Frac Frac 10 Transfer Frac Frac 11 Frac 2&3 6 7 Q1 Q2 Q1 Q3 Q3 Q3 Q3 Q4 2019 2019 2020 2023E 2020 2020 2022E Mont Belvieu Corpus Christi Sweeny Source: Wall Street Research 66

LPG Market Overview U.S. LPG Oceangoing LPG Exports Historical U.S. Propane Export Total (MBpd) 1,500 d ) (MBp 1,250 rt 1,000 Exp o 750 ane Pro p 500 . S 250 U . — 2007A 2008A 2009A 2010A 2011A 2012A 2013A 2014A 2015A 2016A 2017A 2018A 2019A 2020A 2021A 2022A AFR ASI AUS CAN CAR EUR LAT Historical U.S. Ethane Export Total (MBpd) 500 (MBpd) 400 Export 300 Ethane 200 . S 100 U . — 2007A 2008A 2009A 2010A 2011A 2012A 2013A 2014A 2015A 2016A 2017A 2018A 2019A 2020A 2021A 2022A AFR ASI AUS CAN CAR EUR LAT Source: RBN Energy 67

LPG Market Overview LPG Production Growth and Capacity Utilization Terminal Capacity Utilization vs. YoY LPG Production Growth Actual Seaborne Exports 7.0% 3.0 120% 6.1% 6.0% 2.5 100% r ce o u 5.3% S 5.1% by Growth 5.0% 4.7% uction 2.0 80% ro d 4.0% P P G Utiliza L MMBpd tion US 1.5 60% OY (%) Y 3.0% 107% 2.4% 2.0% 1.0 40% 1.9% 2.0% 1.8% 1.7% 70% 64% 58% 58% 66% 68% 61%57% 64% 0.5 20% 1.0% 0.4% 0.2% 0.1% —% -—-% 2022E 2023E 2024E 2025E LPG Production Gas Plants Refinery Utilization Estimate Capacity (MMBpd) Marine Exports (MMBpd) Source: Wall Street Research 68

LPG Market Overview LPG Export Supply Growth Primary Sources Middle East LPG Exports (m tonnes) U.S. LPG Exports (m tonnes) 2 60 8 49 1 1 48 1 3 43 2021A 2022E 2023E 2024E 2024E 2021A 2022E 2023E 2024E 2024E Source: Wall Street Research 69

LPG Market Overview Historical Pricing of NGLs/LPGs vs. Crude Oil Historical Commodity Prices $1.60 $140.00 Domestic Market $1.40 $120.00 $1.20 2018A 2019A 2020A 2021A 2022A $100.00 Ethane $0.32 $0.22 $0.19 $0.31 $0.48 /Gal) $1.00 W $ $80.00 T I Propane $0.87 $0.54 $0.47 $1.04 $1.11 ( ( s $0.80 $ Iso-Butane $1.02 $0.71 $0.59 $1.17 $1.39 NGL $0.60 $60.00 /Bbl ) Normal-Butane $1.01 $0.65 $0.57 $1.18 $1.32 $40.00 Natural Gasoline $1.44 $1.14 $0.78 $1.54 $1.92 $0.40 $20.00 NGLs (Composite) $0.74 $0.51 $0.41 $0.83 $1.00 $0.20 Crude Oil (WTI) $64.94 $56.97 $39.37 $68.07 $94.93 $— $--Jan-18 Jan-19 Jan-20 Jan-21 Jan-22 Dec-22 Ethane Propane NGLs (Composite) Crude Oil (WTI) Historical Commodity Prices (% of WTI) 100% $140.00 Domestic Market 80% $120.00 $100.00 2018A 2019A 2020A 2021A 2022A Ethane 20.8% 16.0% 20.2% 19.0% 21.2% I T 60% $80.00 WTI Propane 56.5% 40.1% 50.1% 64.5% 49.2% W ( $ of $60.00 Iso-Butane 65.7% 52.2% 62.9% 72.5% 61.6% % 40% /Bbl ) Normal-Butane 65.6% 47.9% 61.0% 72.8% 58.2% $40.00 Natural Gasoline 92.8% 84.2% 83.7% 95.3% 85.0% 20% $20.00 NGLs (Composite) 48.0% 37.8% 44.1% 51.0% 44.2% —% $--Jan-18 Jan-19 Jan-20 Jan-21 Jan-22 Dec-22 Ethane Propane NGLs (Composite) Crude Oil (WTI) Source: FactSet as of January 3, 2023 70

LPG Market Overview NGL and LPG Pricing: Historicals vs. NYMEX Strip $ 0 0 $ 1 $ . . . — $ 40 80 20 Historical 2021A $0.83 NGL 2022A $1.00 2023E $0.71 Composite NYMEX 2024E $0.68 Barrel Strip 2025E $0.65 ( $ Pricing 2026E $0.65 /Gal) 2027E $0.65 0 $ 0 $ 0 $ . . . — $ 20 40 60 Historical 2021A $0.31 2022A $0.48 2023E $0.26 Ethane $ ( NYMEX 2024E $0.24 /Gal) Strip 2025E $0.24 Pricing 2026E $0.26 2027E $0.26 0 $ $ 1 1 $ . . . — $ 50 00 50 Historical 2021A $1.04 2022A $1.11 2023E $0.81 Propane $ ( NYMEX 2024E $0.81 /Gal) Strip 2025E $0.78 Pricing 2026E $0.76 2027E $0.76 $ 0 $ 1 1 $ . . . Source: — $ 50 00 50 DCP Historical 2021A $1.17 Management, 2022A $1.39—Iso NYMEX 2023E $1.03 Butane Strip ( as 2024E $0.97 $ of NYMEX 2025E /Gal) January $0.89 Strip 3, 2023 Pricing 2026E $0.89 2027E $0.89 $ 0 1 $ 1 $ . . . — $ 50 00 50 Historical 2021A $1.18 2022A $1.32 Normal—2023E $1.00 71 2024E $0.95 Butane NYMEX $ ( Strip 2025E $0.90 /Gal) Pricing 2026E $0.85 2027E $0.85 0 $ 1 $ 2 $ . . . — $ 75 50 25 Historical 2021A $1.54 2022A $1.92 Natural 2023E $1.49 Gasoline 2024E $1.42 NYMEX $ ( Strip 2025E $1.37 /Gal) Pricing 2026E $1.37 2027E $1.37

LPG Market Overview NGL Consensus Pricing Commentary “Lowering NGL Price Estimates… The decrease is tied to (1) lower plastics demand due to the global economic slowdown, (2) lower global demand for US LPGs (in the near term) and higher projected propane inventory levels, and (3) higher projected NGL supply growth.” “The deterioration in global economic growth is beginning to take a toll on US NGL fundamentals. Processing margins have narrowed (ethane frac spread is negative), ethane rejection is rising and could reduce volumes on NGL pipelines/fracs, and LPG export volumes are declining from record levels in Q2.” Michael Blum, Wells Fargo (October 21, 2022) “3Q22 ethane prices of 55c/gal could fall to ~40c/gal in 4Q22/1Q23, with another step-down to 33c/gal in 2Q23+ as Henry Hub/Waha prices slide to $4.94/$2.18 per Mcf in 2Q23…ethane is typically 35-45% of the composite NGL barrel, causing its pricing to have an outsized impact on NGL prices vs. other purity products.” Chase Mulvehill, BofA Securities (October 9, 2022) “Given the significant increase in oil and gas prices driven by a host of factors including: a strong rebound in oil demand as the world emerges from COVID, continued supply-chain issues which are driving inflation, a tight global LNG market, and the Russia/Ukraine conflict, we are materially increasing our NGL price estimates. We’re raising our 2022 and 2023 NGL price estimates to $1.18/g and $1.06/g, respectively, from $0.92/g and $0.82/g. The increase to our NGL price deck reflects higher near-term crude oil and natural gas price estimates from our E&P and refining teams, partially offset by lower assumed LPG-to-Brent ratios.” Michael Blum, Wells Fargo (March 23, 2022) “The NGL-to-WTI and NGL-to-Brent crude oil ratios averaged 52% and 51%, respectively, in February, both of which are below the prior month. NGL prices to a large extent track Brent more closely than WTI, given that a significant portion of overall demand for NGLs is predicated on exports and competition in the global markets (e.g., ethylene derivative and LPG exports).” Praneeth Satish, Wells Fargo (March 23, 2022) Source: Wall Street Research 72
Exhibit (c)(15)

Exhibit (c)(15) Confidential Reference Materials Project Dynamo August 30, 2022

Confidential DCP | Relative Price Performance Price performance post offer announcement ($34.75 per unit announced on 8/17/2022) Trading Performance: Last Twelve Months Recent Trading Performance (1) DCP—AMZ Adj. Peer Median AMZ (2) One-Day Following Transaction Announcment (8/18/22) 10.5% 7.1% 1.3% 3.9% 1.0% 9.9% 3.1% 3.7% 2.1% 3.9% 3.0% 3.1% 3.4% Since Transaction Announcement (8/17/22) 9.7% 5.1% 1.6% 6.6% 0.5% 9.6% (0.2%) (4.8%) 3.0% 4.1% 3.0% 3.0% 4.6% 10-Days Prior to Announcement 4.1% (1.0%) 6.2% 3.0% 5.9% 7.4% 8.7% (0.4%) 7.5% 5.8% 4.3% 5.9% 5.1% 30-Days Prior to Announcement 13.7% 4.7% 8.1% 1.4% 17.2% 8.4% 41.8% 6.0% 10.5% 11.5% 4.3% 8.4% 9.0% 90-Days Prior to Announcement 5.9% 2.3% 2.3% (10.4%) 3.9% (3.1%) 25.9% (2.5%) (0.5%) (2.1%) 6.9% (0.5%) 3.6% YTD 38.8% 13.4% 8.4% 0.6% 20.0% 56.5% (8.0%) 19.9% 10.3% 34.4% 26.9% 19.9% 25.3% Last Twelve Months 43.6% 14.2% 13.5% 6.5% 27.1% 103.4% 9.1% 16.2% 23.4% 61.1% 49.5% 23.4% 29.4% (Indexed Price Performance) Undisturbed Price Closing Price (8/17/2022): (8/26/2022): $34.75 $38.13 (3) Source: FactSet as of 8/26/2022. (3) 1. Represents calendar days. 2. Reflects one-day trading performance following transaction announcement from 8/17/2022 – 8/18/2022. 3. Core Peers include AM, CEQP, DTM, ENLC, ETRN, KNTK, OKE, TRGP, and WES. 1

Confidential DCP | Relative Valuation EV / EBITDA Debt / EBITDA 2022E-2024E 2022E 2023E 2024E Debt / 2022E EBITDA EBITDA (2.6%) 3.7% 5.5% 6.9% 7.2% 5.2% 12.1% 5.6% 8.1% 2.2% 8.0x Median: 3.9x 3.5x 3.4x CAGR Debt / 2023E EBITDA Debt / 2024E EBITDA 2022E 2023E 2024E EV / 2022E EBITDA 16.0x Median: 9.4x 8.4x 8.3x EV / 2023E EBITDA 6.0x 5.0x 5.0x 12.2x11.5x EV / 2024E EBITDA 12.0x 4.3x 4.5x 11.4x 4.0x 4.0x 10.4x 9.8x 10.0x 9.3x 3.7x 3.9x 3.7x 9.6x 4.0x 3.7x 3.6x 3.6x 8.5x 9.4x 9.4x 9.0x 8.4x 3.6x 3.7x 3.4x 9.2x 3.4x 3.5x 3.5x 3.3x 3.3x 3.4x 8.7x 8.3x 8.5x 3.2x 3.2x 8.1x 8.1x 8.3x 7.9x 8.4x8.4x 7.9x 3.1x 3.0x 7.7x 3.0x 3.0x 3.1x 3.0x 8.0x 7.6x7.3x 7.6x 7.6x 2.9x 7.2x 4.0x 2.0x 0.0x 0.0x Latest Quarterly Distribution Yield Levered FCF Yield 2022E DCF 30% 2022E 2023E 2024E 3.8x 1.8x 1.2x 1.6x 2.2x 2.2x 1.6x 2.5x 4.2x 7.9x 2022E Levered FCF Yield Coverage Median: 6.7% 11.3% 14.2% 2023E Levered FCF Yield 12.0% Median: 6.3% 25% 2024E Levered FCF Yield 9.4% 8.6% 20% 9.0% 8.2% 18.0% 7.1% 14.5% 14.9% 14.9% 14.7% 6.3% 15% 13.5% 14.2% 13.5% 14.2% 13.1% 14.3% 5.8% 12.9% 13.1% 13.8% 6.0% 11.9% 12.1% 4.5% 11.3% 4.4% 10.4% 8.0% 4.2% 10% 8.3% 8.2% 7.2% 7.5% 6.9% 3.0% 6.7% 6.3% 2.0% 4.1% 3.8% 5% 0.0% 0% NA NA Public filings, FactSet, and Wall Street research as of 8/26/2022. DCP projections per Bloomberg consensus estimates as of 6/15/2022. Peer projections per FactSet as of 8/26/2022.

Confidential DCP | Purchase Price Ratio Analysis Purchase Price Ratio Analysis ($ in millions, except per share data) PSX SQ DCP SQ Premium to DCP 6/30/22 6/30/22 5.0% 10.0% 15.0% 20.0% 25.0% 30.0% Precedent Price as of 8/26/22 $92.18 $38.13 $40.04 $41.94 $43.85 $45.76 $47.66 $49.57 Premium Median Mean Premium / (Discount) to Undisturbed Price $89.87 2.6% $34.75 15.2% 20.7% 26.2% 31.7% 37.2% 42.6% Premium / (Discount) to 52-Week High $111.28 (17.2%) $39.54 1.3% 6.1% 10.9% 15.7% 20.5% 25.4% 2.9% 4.7% Premium / (Discount) to 52-Week VWAP $83.14 10.9% $31.60 26.7% 32.7% 38.7% 44.8% 50.8% 56.8% Premium / (Discount) to Median Analyst Target Price $112.00 (17.7%) $45.00 (11.0%) (6.8%) (2.6%) 1.7% 5.9% 10.2% Common Shares / Units Outstanding 485.7 208.4 208.4 208.4 208.4 208.4 208.4 208.4 Total Equity Value $44,768 $7,946 $8,343 $8,740 $9,138 $9,535 $9,932 $10,329 Total Debt 13,076 5,130 5,130 5,130 5,130 5,130 5,130 5,130 Preferred Equity—771 771 771 771 771 771 771 Non-Controlling Interest 297 25 25 25 25 25 25 25 Cash (2,809) (8) (8) (8) (8) (8) (8) (8) Enterprise Value $55,332 $13,864 $14,261 $14,659 $15,056 $15,453 $15,850 $16,248 Public Units Oustanding 90.0 90.0 90.0 90.0 90.0 90.0 90.0 Total Value of Public Units $3,433 $3,604 $3,776 $3,947 $4,119 $4,291 $4,462 Implied Exchange Ratio 0.414x 0.434x 0.455x 0.476x 0.496x 0.517x 0.538x Trading Comparables PSX SQ DCP SQ Peer (1) Peer (1) Transaction Enterprise Value as a Multiple of: Data Data Median Mean Comparables EBITDA 2022E $9,671 5.7x $1,713 8.1x 8.3x 8.6x 8.8x 9.0x 9.3x 9.5x 9.4x 9.5x 8.5x 2023E $8,096 6.8x $1,715 8.1x 8.3x 8.5x 8.8x 9.0x 9.2x 9.5x 8.4x 8.8x 2024E $8,185 6.8x $1,624 8.5x 8.8x 9.0x 9.3x 9.5x 9.8x 10.0x 8.3x 8.4x Equity Value as a Multiple of: Earnings per Share 2022E $11.59 8.0x $4.25 9.0x 9.4x 9.9x 10.3x 10.8x 11.2x 11.7x 16.7x 19.9x 2023E $9.32 9.9x $4.66 8.2x 8.6x 9.0x 9.4x 9.8x 10.2x 10.6x 14.0x 13.7x 2024E $9.24 10.0x $5.63 6.8x 7.1x 7.4x 7.8x 8.1x 8.5x 8.8x 12.5x 11.9x Yield Analysis: Dividends LQA $3.88 4.2% $1.72 4.5% 4.3% 4.1% 3.9% 3.8% 3.6% 3.5% 6.3% 6.2% 2022E $3.75 4.1% $1.65 4.3% 4.1% 3.9% 3.8% 3.6% 3.5% 3.3% 2023E $3.90 4.2% $1.81 4.8% 4.5% 4.3% 4.1% 4.0% 3.8% 3.7% 2024E $4.13 4.5% $1.88 4.9% 4.7% 4.5% 4.3% 4.1% 3.9% 3.8% Leverage Total Debt / EBITDA 2022E $9,671 1.4x $1,713 3.0x 3.0x 3.0x 3.0x 3.0x 3.0x 3.0x 3.9x 3.9x 2023E $8,096 1.6x $1,715 3.0x 3.0x 3.0x 3.0x 3.0x 3.0x 3.0x 3.5x 3.6x 2024E $8,185 1.6x $1,624 3.2x 3.2x 3.2x 3.2x 3.2x 3.2x 3.2x 3.4x 3.4x Net Debt / EBITDA 2022E $9,671 1.1x $1,713 3.0x 3.0x 3.0x 3.0x 3.0x 3.0x 3.0x 2023E $8,096 1.3x $1,715 3.0x 3.0x 3.0x 3.0x 3.0x 3.0x 3.0x 2024E $8,185 1.3x $1,624 3.2x 3.2x 3.2x 3.2x 3.2x 3.2x 3.2x Source: Projections per Bloomberg consensus estimates as of 6/15/2022. Market data as of 8/26/2022. 1. Peers include AM, CEQP, DTM, ENLC, ETRN, KNTK, OKE, TRGP, and WES. 3

Confidential DCP | Unitholder Cost Basis Unit Price Histogram: Last Six Months Average Daily Volume 668,937 VWAP Current (8/26/2022) 6-Month High Total Volume (‘000s) 84,955 $34.04 $38.13 $39.54 Units Outstanding Traded (x) 0.4x a as 60% Total 40% Volume 28.1% of 21.3% 20.3% % 20% 11.7% 11.0% 6.4% 0.0% Trading 1.2% 0% $24.00—$26.00 $26.01—$28.00 $28.01—$30.00 $30.01—$32.00 $32.01—$34.00 $34.01—$36.00 $36.01—$38.00 $38.01—$40.00 Volume (‘000)—1.0 9.4 10.0 23.8 18.1 5.5 17.2 % Units Traded—1.2% 11.0% 11.7% 28.1% 21.3% 6.4% 20.3% Cumulative—1.2% 12.2% 23.9% 52.0% 73.3% 79.7% 100.0% Unit Price Histogram: Last 12 Months Average Daily Volume 620,031 Total Volume (‘000s) 156,868 VWAP Current (8/26/2022) 12-Month High Units Outstanding Traded (x) 0.8x $31.60 $38.13 $39.54 a as Total 50% Volume of 25% 15.9% 20.5% 18.5% % 12.9% 11.5% 11.0% Trading 6.2% 3.5% 0% $24.00—$26.00 $26.01—$28.00 $28.01—$30.00 $30.01—$32.00 $32.01—$34.00 $34.01—$36.00 $36.01—$38.00 $38.01—$40.00 Volume (‘000) 9.7 20.2 24.9 32.2 29.0 18.1 5.5 17.2 % Units Traded 6.2% 12.9% 15.9% 20.5% 18.5% 11.5% 3.5% 11.0% Cumulative 6.2% 19.1% 35.0% 55.5% 74.0% 85.5% 89.0% 100.0% Source: Factset as of 8/26/2022. Units Outstanding Traded based on unaffiliated DCP units outstanding per public filings. 4

Confidential DCP | Trading Comparables Core Peers Trading Comparables Undisturbed ($USD in millions except per unit data) Price (8/17/2022) Median Unit / Share Price as of 8/26/22 $38.13 $34.75(1) $10.49 $27.76 $57.56 $10.78 $9.51 $36.75 $64.84 $70.21 $28.25 % of 52-week high (Close) 97% 97% 90% 86% 97% 92% 84% 82% 88% 87% 96% 88% Fully Diluted Units / Shares Outstanding 208 208 478 109 97 479 433 135 447 227 386 Total Equity Value $7,946 $7,241 $5,019 $3,033 $5,568 $5,163 $4,116 $4,961 $28,975 $15,907 $10,917 Debt 5,130 5,130 3,181 3,699 3,099 4,355 6,849 3,000 13,877 11,088 6,723 Preferred Equity 771 771 — 666 — 1,213 682 463 0 — -Noncontrolling Interest 25 25 — 434 — — — — — — -Cash (8) (8) — (304) (345) (18) (115) (5) (136) (154) (97) Enterprise Value $13,864 $13,160 $8,200 $7,528 $8,322 $10,713 $11,532 $8,419 $42,715 $26,841 $17,543 Enterprise Value / 2022E EBITDA 8.1 x 7.7 x 9.4 x 9.2 x 10.4 x 8.4 x 8.4 x 10.0 x 12.2 x 9.6 x 7.9 x 9.4 x 2023E EBITDA 8.1 x 7.7 x 9.0 x 7.6 x 9.8 x 7.9 x 8.4 x 9.3 x 11.5 x 8.3 x 7.7 x 8.4 x 2024E EBITDA 8.5 x 8.1 x 8.5 x 7.3 x 9.4 x 7.6 x 7.2 x 8.7 x 11.4 x 8.3 x 7.6 x 8.3 x Valuation Metrics LQA Yield 4.51% 4.95% 8.58% 9.44% 4.45% 4.17% 6.31% 8.16% 5.77% 1.99% 7.08% 6.31% 2022E Yield 4.33% 4.75% 8.58% 9.44% 4.45% 4.17% 6.31% 8.16% 5.77% 1.99% 7.08% 6.31% 2023E Yield 4.75% 5.22% 8.58% 9.91% 4.58% 4.64% 6.31% 8.57% 5.77% 1.99% 7.08% 6.31% 2024E Yield 4.93% 5.41% 8.58% 10.41% 4.72% 5.01% 6.31% 9.01% 5.77% 1.99% 7.08% 6.31% 2022E DCF Yield 16.00% 17.56% 10.23% 17.26% 11.19% 17.43% 13.61% 13.14% 9.01% 15.85% 15.29% 13.61% 2023E DCF Yield 16.81% 18.45% 10.86% 21.11% 11.96% 18.49% 14.42% 13.77% 9.73% 17.48% 15.99% 14.42% 2024E DCF Yield 15.87% 17.41% 12.15% 22.74% 12.67% 19.27% 21.07% 14.91% 10.04% 17.29% 16.28% 16.28% (2) 2022E FCF Yield(2) 12.88% 14.13% 8.27% NA 6.72% 4.14% 3.85% 13.14% 6.34% NA 11.93% 6.72% 2023E FCF Yield 13.47% 14.78% 10.40% 14.68% 7.49% 11.32% 6.90% 13.77% 7.20% 14.34% 14.24% 11.32% (2) 2024E FCF Yield 13.55% 14.87% 12.15% 17.96% 8.21% 13.08% 14.18% 14.91% 7.97% 14.90% 14.54% 14.18% 2022E P / EPS 9.0x 8.2x 14.6x 53.4x 16.3x 18.6x 16.7x 12.5x 17.9x 19.7x 9.0x 16.7 x 2023E P / EPS 8.2x 7.5x 14.0x 12.5x 15.4x 17.1x 16.1x 10.6x 16.3x 13.3x 8.3x 14.0 x 2024E P / EPS 6.8x 6.2x 12.5x 10.3x 14.5x 14.2x 8.6x 9.1x 16.0x 13.8x 7.8x 12.5 x Coverage 2022E Coverage 3.72 x 3.72 x 1.19 x 1.83 x 2.52 x 4.18 x 2.16 x 1.61 x 1.56 x 7.95 x 2.16 x 2.16 x 2023E Coverage 3.74 x 3.74 x 1.27 x 2.13 x 2.61 x 3.99 x 2.29 x 1.61 x 1.69 x 8.77 x 2.26 x 2.26 x 2024E Coverage 3.53 x 3.53 x 1.42 x 2.18 x 2.69 x 3.85 x 3.34 x 1.66 x 1.74 x 8.67 x 2.30 x 2.30 x Credit Statistics Debt / 2022E EBITDA 3.0 x 3.0 x 3.6 x 4.5 x 3.9 x 3.4 x 5.0 x 3.6 x 4.0 x 4.0 x 3.0 x 3.9 x Debt + Pref / 2022E EBITDA(3) 3.2 x 3.2 x 3.6 x 4.9 x 3.9 x 3.9 x 5.2 x 3.8 x 4.0 x 4.0 x 3.0 x 3.9 x Debt / 2023E EBITDA (3) 3.0 x 3.0 x 3.5 x 3.7 x 3.7 x 3.2 x 5.0 x 3.3 x 3.7 x 3.4 x 3.0 x 3.5 x Debt + Pref / 2023E EBITDA 3.2 x 3.2 x 3.5 x 4.1 x 3.7 x 3.6 x 5.3 x 3.6 x 3.7 x 3.4 x 3.0 x 3.6 x lic filings, Wall Street research and FactSet as of 8/26/2022. DCP Balance Sheet items, projections, and common units / shares outstanding per Bloomberg estimates as of 6/15/2022. eflects undisturbed offer price on 8/17/2022. lated as levered free cash flow divided by equity value as of 8/26/2022. es 50% of preferred equity.
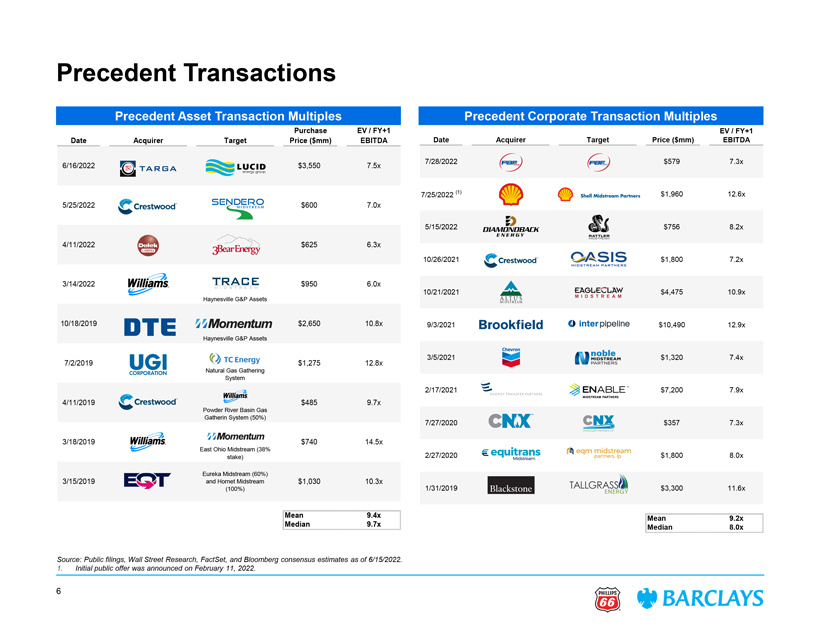
Confidential Precedent Transactions Precedent Asset Transaction Multiples Precedent Corporate Transaction Multiples Purchase EV / FY+1 EV / FY+1 Date Acquirer Target Price ($mm) EBITDA Date Acquirer Target Price ($mm) EBITDA 7/28/2022 $579 7.3x 6/16/2022 $3,550 7.5x 7/25/2022 (1) $1,960 12.6x 5/25/2022 $600 7.0x 5/15/2022 $756 8.2x 4/11/2022 $625 6.3x 10/26/2021 $1,800 7.2x $950 6.0x 10/21/2021 $4,475 10.9x 2,650 10.8x 9/3/2021 $10,490 12.9x 3/5/2021 $1,320 7.4x 1,275 12.8x 2/17/2021 $7,200 7.9x $485 9.7x 7/27/2020 $357 7.3x $740 14.5x 2/27/2020 $1,800 8.0x 1,030 10.3x 1/31/2019 $3,300 11.6x 9.4x Mean 9.2x 9.7x Median 8.0x Source: Public filings, Wall Street Research, FactSet, and Bloomberg consensus estimates as of 6/15/2022. 1. Initial public offer was announced on February 11, 2022. 6

Confidential Precedent Premiums Paid Selected MLP Buy-in Transactions, 2018—Present Total Initial Initial Premium Paid Premium Paid Announced Transaction Enterprise Value Price Premium Final (Days Prior to Initial Ann.)(2) (Days Prior to Final Ann.)(3) (1) 30-Day 30-Day Date Acquirer Target Value ($MM) Acquirer Target Offered Offered Price 1-Day 1-Day Consideration Process VWAP VWAP (4) (4) 7/28/2022 $579 $7,229 $1,690 NA NA $17.66 31.6% 11.0% (3.4%) 13.2% Cash and Unit Exchange Negotiate then Ann. (5) 7/25/2022 $2,608 $237,598 $9,749 $12.89 0.0% $15.85 23.0% 23.5% 9.6% 11.6% 100% Cash Ann. then Negotiate 4/22/2022 $400 NA $595 $3.32 0.9% $4.65 41.3% 42.7% 40.9% 40.7% 100% Cash Ann. then Negotiate 10/27/2021 $3,466 $16,829 $13,076 $32.57 0.0% $41.11 4.8% 7.6% 4.8% 7.6% 100% Unit Exchange Negotiate then Ann. (6) 8/5/2021 $874 $126,182 $1,694 $13.01 0.0% $15.12 16.2% 8.9% 17.1% 17.2% 100% Unit Exchange Ann. then Negotiate (7) 2/5/2021 $1,149 $201,401 $2,872 $12.47 0.0% $14.56 16.7% 18.7% (3.3%) 5.8% 100% Unit Exchange Ann. then Negotiate 10/5/2020 (8) $2,829 $74,892 $3,361 $27.31 5.4% $30.95 19.5% 15.1% 0.6% (0.7%) 100% Unit Exchange Ann. then Negotiate 7/27/2020 $693 $4,419 $1,312 $8.38 4.5% $8.47 28.1% 29.1% 28.1% 29.1% 100% Unit Exchange Negotiate then Ann. 11/26/2018 $536 NA $1,246 $38.00 4.4% $41.00 12.6% 9.5% 12.6% 9.5% 100% Cash Negotiate then Ann. 11/8/2018 $8,965 $7,251 $12,230 $43.77 5.0% $50.33 7.6% 14.3% 7.6% 14.3% 100% Unit Exchange Negotiate then Ann. 10/18/2018 $1,850 $50,344 $3,660 $40.00 10.7% $42.25 6.0% 10.2% 6.0% 10.2% 100% Cash Negotiate then Ann. (9) 9/19/2018 $2,634 $86,611 $6,683 $17.75 0.0% $18.22 2.6% 8.8% 0.5% 1.0% 100% Unit Exchange Ann. then Negotiate 8/1/2018 $60,345 $26,932 $80,353 $21.32 5.0% $23.59 11.2% 17.5% 11.2% 17.5% 100% Unit Exchange Negotiate then Ann. (10) 5/29/2018 er (11) 5/17/2018 $ otiate (12) 5/17/2018 $10,010 $121,978 $14,694 otiate 5/17/2018 $15,105 $29,816 $55,383 $36.94 5.2% $40.89 6.4% 11.2% 6.4% 11.2% 100% Unit Exchange Negotiate then Ann. 3/27/2018 $3,224 $3,418 $4,942 $41.34 (0.5%) $35.42 0.6% (8.1%) 0.6% (8.1%) 100% Unit Exchange Negotiate then Ann. Source: Price data per FactSet. Transaction value and consideration paid based on public filings, company press releases, and investor presentations. 1. Transaction value includes only un-affiliated and proportional net debt. 2. Premium paid to initial announcement represents the premium based on the final agreed upon price relative to the original offer’s unaffected date. 3. Premium paid to final announcement represents the premium based on the final agreed upon price relative to the final announcement’s unaffected date. 4. Initial price offered not yet disclosed. Transaction value and premium reflect unaffected PBF price as of 7/27/2022. Initial announcement date reflects filing of Schedule 13D/A on June 24, 2022. dstream Partners LP based on revised offer announced 7/25/2022. Premium paid based on closing price prior to original announcement on 2/11/2022. dstream Partners LP based on revised offer announced 12/20/2021. Premium paid based on closing price prior to original announcement on 8/4/2021. Midstream Partners based on revised offer announced 3/5/2021. Premium paid based on closing price prior to original announcement on 2/4/2021. Pipeline based on revised offer announced 12/15/2020. Premium paid based on closing price prior to original announcement on 10/5/2020. / Dominion Energy Midstream based on revised offer announced 11/23/2018. Premium paid based on closing price prior to original announcement on 9/8/2018. CVI announced it would exercise the call right on 1/17/19. revised offer announced on 8/24/2018. Enbridge price performance based on original announcement on 5/17/2018. based on revised offer announced 9/18/2018. Enbridge price performance based on original announcement on 5/17/2018.
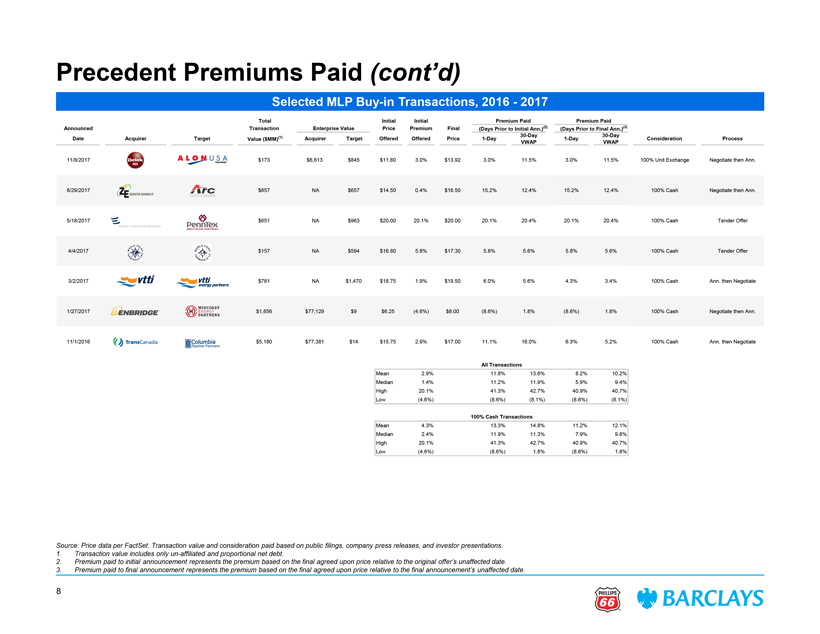
Confidential Precedent Premiums Paid (cont’d) Selected MLP Buy-in Transactions, 2016—2017 Total Initial Initial Premium Paid Premium Paid Announced Transaction Enterprise Value Price Premium Final (Days Prior to Initial Ann.)(2) (Days Prior to Final Ann.)(3) (1) 30-Day 30-Day Date Acquirer Target Value ($MM) Acquirer Target Offered Offered Price 1-Day 1-Day Consideration Process VWAP VWAP 11/8/2017 $173 $6,613 $845 $11.80 3.0% $13.92 3.0% 11.5% 3.0% 11.5% 100% Unit Exchange Negotiate then Ann. 8/29/2017 $657 NA $657 $14.50 0.4% $16.50 15.2% 12.4% 15.2% 12.4% 100% Cash Negotiate then Ann. 5/18/2017 $651 NA $963 $20.00 20.1% $20.00 20.1% 20.4% 20.1% 20.4% 100% Cash Tender Offer 4/4/2017 $157 NA $594 $16.80 5.8% $17.30 5.8% 5.6% 5.8% 5.6% 100% Cash Tender Offer 3/2/2017 $781 NA $1,470 $18.75 1.9% $19.50 6.0% 5.6% 4.3% 3.4% 100% Cash Ann. then Negotiate $9 $6.25 (4.6%) $8.00 (8.6%) 1.8% (8.6%) 1.8% 100% Cash Negotiate then Ann. $14 $15.75 2.9% $17.00 11.1% 16.0% 6.3% 5.2% 100% Cash Ann. then Negotiate All Transactions Mean 2.9% 11.8% 13.6% 8.2% 10.2% Median 1.4% 11.2% 11.9% 5.9% 9.4% High 20.1% 41.3% 42.7% 40.9% 40.7% Low (4.6%) (8.6%) (8.1%) (8.6%) (8.1%) 100% Cash Transactions Mean 4.3% 13.3% 14.8% 11.2% 12.1% Median 2.4% 11.9% 11.3% 7.9% 9.8% High 20.1% 41.3% 42.7% 40.9% 40.7% Low (4.6%) (8.6%) 1.8% (8.6%) 1.8% company press releases, and investor presentations. on price relative to the original offer’s unaffected date. on price relative to the final announcement’s unaffected date.

Confidential DCP | Equity Analyst Price Targets Research Price Targets (1) (2) Price Targets ($ / share) Median Analyst Target Price Premium / (Discount) to: Premium / (Discount) % to Current Price Current Price 18% Current: $70.21 $100.00 1 $91.00 0. Current: $80.00 $64.84 0. Current: $57.56 $69.00 0. Median $59.50 $60.00 0. Price Current: Current: $36.75 Target: Current: 0. $45.00 $45.00 $45.00 $45.00 $45.00 $27.76 $45.00 $42.00 $28.25 $40.00 $38.00 $36.00 0. Current 30% $33.00 DCP: Current: Current: 0. Current: $38.13 18% 18% 18% $10.49 30% $10.78 17% $9.51 $20.00 14% 0. $11.00 $12.00 $10.00 18% 18% 3% 6% 5% 0. 5% 11% (0%) $0.00 0 2 3 4 5 7 8 10 11 13 14 15 8/18/2022 8/17/2022 8/17/2022 8/8/2022 8/8/2022 8/2/2022 Analyst Recommendation Buy ✓ ✓ ✓ ✓ ✓ 1 5 5 2 3 2 4 11 6 Hold ~ 3 1 0 4 4 0 9 0 2 Sell 1 0 0 0 0 0 0 0 0 Source: FactSet as of 8/26/2022. 5 6 5 6 7 2 13 11 8 1. Includes available reports from reputable brokers since Q2’22 earnings release that have provided a price target. 2. Peer group price targets reflect average analyst price target. 9

Confidential Disclaimer This document has been prepared by Barclays Capital Inc. (“Barclays”) for information purposes only. This document is confidential and for the sole and exclusive benefit and internal use of the Recipient in connection with the matter or possible transaction to which this document relates, and no part of it may be reproduced, distributed or transmitted without the prior written permission of Barclays. This document is an indicative summary of the terms and conditions of the transaction described herein and may be amended, superseded or replaced by subsequent summaries. The final terms and conditions of the transaction will be set out in full in the applicable binding transaction document(s). This document is incomplete without reference to, and should be assessed solely in conjunction with, the oral briefing provided by Barclays. Neither Barclays nor any of its subsidiaries or affiliates shall be obliged by having made this document available to you to provide any financial advisory services (whether in relation to the matter or possible transaction to which this document relates or otherwise) or to sell, acquire, place or underwrite any securities or to lend moneys or to provide any other commitment, facility, product, risk management solution or service, nor does Barclays represent by providing this document to the Recipient that it will be possible for Barclays to provide, arrange or undertake any of the aforementioned services, activities, products or solutions. Any commitment by Barclays to provide, arrange or undertake any of the aforementioned services, activities, products or solutions would be subject to Barclays signing appropriate documentation, obtaining all necessary internal approvals and completing due diligence, in each case in a manner satisfactory to Barclays. This document was prepared on the basis of information and data, obtained from publicly available sources and, where applicable, from the Recipient and/or any other entity that may be involved in any transaction or matter contemplated by this document (and/or any of the Recipient’s or the aforementioned entities’ affiliates), in each case prior to or on the date hereof. Barclays makes no warranty or representation, express or implied, as to the accuracy or completeness of information which is contained in this document and which is stated to have been obtained from or is based upon trade and statistical services or other third party sources. The information in this document has not been independently verified by Barclays and Barclays does not assume any liability for any such information. Any data on past performance, modeling or back-testing contained herein is no indication as to future performance. No representation is made as to the reasonableness of the assumptions made within or the accuracy or completeness of any modeling or back-testing or any other information contained herein. All opinions and estimates are given as of the date hereof and are subject to change and Barclays assumes no obligation to update this document to reflect any such changes. The value of any investment may fluctuate as a result of market changes. The information herein is not intended to predict actual results and no assurances are given with respect thereto. Nothing herein shall be deemed to constitute investment, legal, tax, financial, accounting or other advice. The Recipient is responsible for making its own independent investigation and appraisal of the risks, benefits, appropriateness and suitability of any transaction or matter contemplated by this document and Barclays is not making any recommendation (personal or otherwise) or giving any investment advice and will have no liability with respect thereto. The decision to proceed with any transaction or action contemplated by this document must be made by the Recipient in the light of its own commercial assessments and Barclays will not be responsible for such assessments. Neither Barclays nor any of its subsidiaries or affiliates, nor any of their respective directors, officers, employees, advisors or other representatives (Barclays together with such persons being the “Barclays Group”) accepts any liability whatsoever for any direct, indirect or consequential losses (in contract, tort or otherwise) arising from the use of this document or its contents or any reliance on the information contained herein. Barclays Group is not responsible for any specialized advice (including financial, tax, legal and accounting, among other advice). This document does not constitute nor does it form part of an offer to sell or purchase, or the solicitation of an offer to sell or purchase, any securities or any of the businesses or assets described herein or an offer or recommendation to enter into any transaction described herein nor does this document constitute an offer or commitment to provide, arrange or underwrite any financing. Members of the Barclays Group are involved in a wide range of commercial banking, investment banking and other activities out of which conflicting interests or duties may arise. In the ordinary course of its business, the Barclays Group may provide services to any other entity or person whether or not a member of the same group as the Recipient (a “Third Party”), engage in any transaction (whether on its own account, on behalf of any Third Party or otherwise, and including any transaction or matter contemplated by this document), notwithstanding that such services, transactions or actions may be adverse to the Recipient or any member of the Recipient’s group, and the Barclays Group may retain for its own benefit any related remuneration or profit. The Barclays Group operates in accordance with a conflicts of interest policy which identifies conflicts of interest it faces in the ordinary course of its business, and establishes organisational and procedural measures to manage those conflicts where it is reasonably able to do so. Neither Barclays nor any other part of the Barclays Group shall have any duty to disclose to the Recipient or utilise for the Recipient’s benefit any non-public information acquired in the course of providing services to any other person, engaging in any transaction (on its own account or otherwise) or otherwise carrying on its business. The Barclays Group’s research analysts and research departments are independent from its banking business and are subject to certain regulations and internal policies. The Barclays Group’s research analysts may hold opinions and make statements or investment recommendations and/or publish research reports with respect to any company referred to herein, the transactions contemplated herein or any person or entity involved therein or related thereto that differ from or are inconsistent with the views or advice communicated by the Barclays Group’s banking business. Barclays is a full service securities firm and as such from time to time may effect transactions for its own account or the account of its clients and hold long or short positions in debt, equity or other securities of the companies referred to herein or in other financial products and instruments. Unless otherwise expressly agreed or provided for in other applicable Barclays disclosures governing such transactions or required by law or regulation, Barclays conducts these activities as principal and executes its principal transactions as an arm’s length counterparty. Barclays does not act as a fiduciary in relation to these transactions. THIS DOCUMENT DOES NOT DISCLOSE ALL THE RISKS AND OTHER SIGNIFICANT ISSUES RELATED TO AN INVESTMENT IN THE SECURITIES, FINANCIAL INSTRUMENTS OR TRANSACTIONS DESCRIBED HEREIN. PRIOR TO TRANSACTING, YOU SHOULD ENSURE THAT YOU FULLY UNDERSTAND THE TERMS OF THE TRANSACTION AND ANY APPLICABLE RISKS. The information contained herein is not intended to be distributed to any prospective or actual investors and, accordingly, may not be shown or given to any person other than the recipient, and is not to be forwarded to any other person (including any retail investor or customer), copied or otherwise reproduced or distributed to any such person in any manner whatsoever. FAILURE TO COMPLY WITH THIS DIRECTIVE CAN RESULT IN A VIOLATION OF THE SECURITIES ACT OF 1933, AS AMENDED. These materials have not been produced by the Barclays Group’s research department and do not constitute investment research or a research recommendation for the purposes of the Financial Conduct Authority rules or a research report under applicable U.S. law. Barclays Capital Inc. is the United States investment bank of Barclays Bank PLC. Barclays Bank PLC is authorised by the Prudential Regulation Authority and regulated by the Financial Conduct Authority and the Prudential Regulation Authority (Financial Services Register No. 122702). Registered in England. Registered No. 1026167. Registered office: 1 Churchill Place, London E14 5HP. Copyright Barclays Bank PLC, 2022 (all rights reserved). 10
Exhibit (c)(16)

Exhibit (c)(16) Project Dynamo Negotiation Summary January 3, 2023

Negotiation Summary Key Events ï,— On August 17, 2022, Phillips 66 (PSX) offered to acquire all outstanding publicly held common units of DCP Midstream, LP (DCP) for $34.75 per common unit in cashï,¡ The DCP Board of Directors subsequently authorized the Conflicts Committee to review and negotiate the transactionï,¡ The Conflicts Committee hired Evercore Group L.L.C. as financial advisorï,— On September 22, 2022, Evercore provided DCP management with its initial information request listï,¡ Due diligence process was initiated on that dateï,— On September 29, 2022, DCP management conducted a management presentation to the DCP Conflicts Committee and its advisorsï,— On October 10, 2022, projected financial forecast and estimated incremental efficiencies were provided to Evercoreï,— Between November 2, 2022 and December 22, 2022, the DCP Conflicts Committee and PSX exchanged proposals ï,— On December 31, 2022, PSX and the DCP Conflicts Committee agreed to PSX’s final counteroffer of $41.75 per common unit in cash Summary of Proposals Offer Price Implied Premium to DCP Unit Price as of: DCP Closing Price Proposal (1) Proposal Date (Previous Day) Offer Price 8/17/22 11/2/22 11/11/22 11/23/22 11/28/22 12/1/22 12/6/22 12/14/22 12/16/22 12/17/22 12/19/22 12/19/22 12/22/22 12/31/22 Initial PSX Offer 8/17/22 $34.75 (1) $34.75—N/A N/A N/A N/A N/A N/A N/A N/A N/A N/A N/A N/A N/A 1st DCP CC Counter 11/2/22 $39.14 $49.00 41.0% 25.2% N/A N/A N/A N/A N/A N/A N/A N/A N/A N/A N/A N/A 1st PSX Counter 11/11/22 $39.49 $38.25 10.1% (2.3%) (3.1%) N/A N/A N/A N/A N/A N/A N/A N/A N/A N/A N/A 2nd DCP CC Counter 11/23/22 $38.49 $47.25 36.0% 20.7% 19.7% 22.8% N/A N/A N/A N/A N/A N/A N/A N/A N/A N/A 2nd PSX Counter 11/28/22 $39.00 $39.25 12.9% 0.3% (0.6%) 2.0% 0.6% N/A N/A N/A N/A N/A N/A N/A N/A N/A 3rd DCP CC Counter 12/1/22 $39.34 $46.25 33.1% 18.2% 17.1% 20.2% 18.6% 17.6% N/A N/A N/A N/A N/A N/A N/A N/A 3rd PSX Counter 12/6/22 $39.27 $39.75 14.4% 1.6% 0.7% 3.3% 1.9% 1.0% 1.2% N/A N/A N/A N/A N/A N/A N/A 4th DCP CC Counter 12/14/22 $39.09 $44.75 28.8% 14.3% 13.3% 16.3% 14.7% 13.8% 14.0% 14.5% N/A N/A N/A N/A N/A N/A 4th PSX Counter 12/16/22 $38.12 $40.50 16.5% 3.5% 2.6% 5.2% 3.8% 2.9% 3.1% 3.6% 6.2% N/A N/A N/A N/A N/A 5th DCP CC Counter 12/17/22 $38.74 $43.25 24.5% 10.5% 9.5% 12.4% 10.9% 9.9% 10.1% 10.6% 13.5% 11.6% N/A N/A N/A N/A 5th PSX Counter 12/19/22 $38.74 $41.00 18.0% 4.8% 3.8% 6.5% 5.1% 4.2% 4.4% 4.9% 7.6% 5.8% 5.8% N/A N/A N/A 6th DCP CC Counter 12/19/22 $38.31 (1) $42.75 23.0% 9.2% 8.3% 11.1% 9.6% 8.7% 8.9% 9.4% 12.1% 10.4% 10.4% 11.6% N/A N/A 6th PSX Counter 12/22/22 $38.31 $41.75 20.1% 6.7% 5.7% 8.5% 7.1% 6.1% 6.3% 6.8% 9.5% 7.8% 7.8% 9.0% 9.0% N/A Final Agreement 12/31/22 $38.79 $41.75 20.1% 6.7% 5.7% 8.5% 7.1% 6.1% 6.3% 6.8% 9.5% 7.8% 7.8% 9.0% 9.0% 7.6% Source: Factset as of 12/30/2022. 1. Reflects same-day, undisturbed closing price (offer made after market close). 1

Selected Meeting Overview Meeting Detail Meeting Date Attendees DCP Forecast Model Discussion 9/26/2022 PSX, DCP, Barclays PSX, DCP, Barclays, Bracewell, Initial Management Presentation 9/29/2022 Evercore, Conflicts Committee DCP Forecast Model Discussion 10/6/2022 PSX, DCP, Barclays PSX, DCP, Barclays, Bracewell, Evercore Diligence Call 10/24/2022 Evercore Barclays / Evercore Input Discussion 11/6/2022 Barclays, Evercore PSX, DCP, Barclays, Bracewell, Evercore Discussion with DCP Management 11/21/2022 Evercore 2

DCP | Purchase Price Ratio Analysis Purchase Price Ratio Analysis ($ in millions, except per share data) PSX SQ DCP SQ Initial 1st PSX 2nd PSX 3rd PSX 4th PSX 5th PSX 6th PSX Final 6th DCP CC 5th DCP CC 4th DCP CC 3rd DCP CC 2nd DCP CC 1st DCP CC Offer Counter Counter Counter Counter Counter Counter Agreement Counter Counter Counter Counter Counter Counter 9/30/22 12/31/22 (8/17/22) (11/11/22) (11/28/22) (12/6/22) (12/16/22) (12/19/22) (12/22/22) (12/31/22) (12/19/22) (12/17/22) (12/14/22) (12/1/22) (11/23/22) (11/2/22) Price as of 12/30/22 $104.08 $38.79 $34.75 $38.25 $39.25 $39.75 $40.50 $41.00 $41.75 $41.75 $42.75 $43.25 $44.75 $46.25 $47.25 $49.00 Premium / (Discount) to Undisturbed Price (8/17/22) 15.8% $89.87 11.6% $34.75—10.1% 12.9% 14.4% 16.5% 18.0% 20.1% 20.1% 23.0% 24.5% 28.8% 33.1% 36.0% 41.0% Premium / (Discount) to 52-Week High (8.3%) $113.53 (3.6%) $40.23 (13.6%) (4.9%) (2.4%) (1.2%) 0.7% 1.9% 3.8% 3.8% 6.3% 7.5% 11.2% 15.0% 17.4% 21.8% Premium / (Discount) to 52-Week VWAP 15.6% $90.04 10.3% $35.15 (1.1%) 8.8% 11.7% 13.1% 15.2% 16.6% 18.8% 18.8% 21.6% 23.0% 27.3% 31.6% 34.4% 39.4% Premium / (Discount) to Median Analyst Target Price (13.3%) $120.00 (13.8%) $45.00 (22.8%) (15.0%) (12.8%) (11.7%) (10.0%) (8.9%) (7.2%) (7.2%) (5.0%) (3.9%) (0.6%) 2.8% 5.0% 8.9% Common Shares / Units Outstanding 478.1 208.4 208.4 208.4 208.4 208.4 208.4 208.4 208.4 208.4 208.4 208.4 208.4 208.4 208.4 208.4 Total Equity Value $49,764 $8,084 $7,242 $7,971 $8,180 $8,284 $8,440 $8,544 $8,701 $8,701 $8,909 $9,013 $9,326 $9,638 $9,847 $10,211 Total Debt 17,804 5,331 5,331 5,331 5,331 5,331 5,331 5,331 5,331 5,331 5,331 5,331 5,331 5,331 5,331 5,331 Preferred Equity—271 271 271 271 271 271 271 271 271 271 271 271 271 271 271 Non-Controlling Interest 5,076 25 25 25 25 25 25 25 25 25 25 25 25 25 25 25 Cash (3,744) — — — — — — ——Enterprise Value $68,900 $13,711 $12,869 $13,598 $13,807 $13,911 $14,067 $14,171 $14,328 $14,328 $14,536 $14,640 $14,953 $15,265 $15,474 $15,839 Public Units Oustanding 90.6 90.6 90.6 90.6 90.6 90.6 90.6 90.6 90.6 90.6 90.6 90.6 90.6 90.6 90.6 Total Value of Public Units $3,515 $3,149 $3,466 $3,556 $3,602 $3,670 $3,715 $3,783 $3,783 $3,874 $3,919 $4,055 $4,191 $4,281 $4,440 Implied Exchange Ratio 0.373x 0.334x 0.368x 0.377x 0.382x 0.389x 0.394x 0.401x 0.401x 0.411x 0.416x 0.430x 0.444x 0.454x 0.471x Enterprise Value as a Multiple of: Data Data Adj. EBITDA 2022E $9,671 7.1x $1,749 7.8x 7.4x 7.8x 7.9x 8.0x 8.0x 8.1x 8.2x 8.2x 8.3x 8.4x 8.5x 8.7x 8.8x 9.1x 2023E $8,096 8.5x $1,698 8.1x 7.6x 8.0x 8.1x 8.2x 8.3x 8.3x 8.4x 8.4x 8.6x 8.6x 8.8x 9.0x 9.1x 9.3x 2024E $8,185 8.4x $1,578 8.7x 8.2x 8.6x 8.8x 8.8x 8.9x 9.0x 9.1x 9.1x 9.2x 9.3x 9.5x 9.7x 9.8x 10.0x Yield Analysis: Levered Free Cash Flow 2022E $12.72 12.2% $3.04 7.8% 8.7% 7.9% 7.7% 7.6% 7.5% 7.4% 7.3% 7.3% 7.1% 7.0% 6.8% 6.6% 6.4% 6.2% 2023E $9.62 9.2% $3.60 9.3% 10.4% 9.4% 9.2% 9.1% 8.9% 8.8% 8.6% 8.6% 8.4% 8.3% 8.1% 7.8% 7.6% 7.4% 2024E $9.58 9.2% $3.59 9.3% 10.3% 9.4% 9.1% 9.0% 8.9% 8.8% 8.6% 8.6% 8.4% 8.3% 8.0% 7.8% 7.6% 7.3% Dividends LQA $3.88 3.7% $1.72 4.4% 4.9% 4.5% 4.4% 4.3% 4.2% 4.2% 4.1% 4.1% 4.0% 4.0% 3.8% 3.7% 3.6% 3.5% 2022E $3.75 3.6% $1.68 4.3% 4.8% 4.4% 4.3% 4.2% 4.1% 4.1% 4.0% 4.0% 3.9% 3.9% 3.8% 3.6% 3.6% 3.4% 2023E $3.90 3.7% $1.72 4.4% 4.9% 4.5% 4.4% 4.3% 4.2% 4.2% 4.1% 4.1% 4.0% 4.0% 3.8% 3.7% 3.6% 3.5% 2024E $4.13 4.0% $1.72 4.4% 4.9% 4.5% 4.4% 4.3% 4.2% 4.2% 4.1% 4.1% 4.0% 4.0% 3.8% 3.7% 3.6% 3.5% Leverage Total Debt / Adj. EBITDA 2022E $9,671 1.8x $1,749 3.0x 3.0x 3.0x 3.0x 3.0x 3.0x 3.0x 3.0x 3.0x 3.0x 3.0x 3.0x 3.0x 3.0x 3.0x 2023E $8,096 2.2x $1,698 3.1x 3.1x 3.1x 3.1x 3.1x 3.1x 3.1x 3.1x 3.1x 3.1x 3.1x 3.1x 3.1x 3.1x 3.1x 2024E $8,185 2.2x $1,578 3.4x 3.4x 3.4x 3.4x 3.4x 3.4x 3.4x 3.4x 3.4x 3.4x 3.4x 3.4x 3.4x 3.4x 3.4x Net Debt / Adj. EBITDA 2022E $9,671 1.5x $1,749 3.0x 3.0x 3.0x 3.0x 3.0x 3.0x 3.0x 3.0x 3.0x 3.0x 3.0x 3.0x 3.0x 3.0x 3.0x 2023E $8,096 1.7x $1,698 3.1x 3.1x 3.1x 3.1x 3.1x 3.1x 3.1x 3.1x 3.1x 3.1x 3.1x 3.1x 3.1x 3.1x 3.1x 2024E $8,185 1.7x $1,578 3.4x 3.4x 3.4x 3.4x 3.4x 3.4x 3.4x 3.4x 3.4x 3.4x 3.4x 3.4x 3.4x 3.4x 3.4x Source: DCP projections and 12/31/22 balance sheet per DCP Management, provided 10/10/2022. PSX projections per Bloomberg consensus estimates as of 6/15/2022. Market data as of 12/30/2022. 3

Disclaimer This document has been prepared by Barclays Capital Inc. (“Barclays”) for information purposes only. This document is confidential and for the sole and exclusive benefit and internal use of the Recipient in connection with the matter or possible transaction to which this document relates, and no part of it may be reproduced, distributed or transmitted without the prior written permission of Barclays. This document is an indicative summary of the terms and conditions of the transaction described herein and may be amended, superseded or replaced by subsequent summaries. The final terms and conditions of the transaction will be set out in full in the applicable binding transaction document(s). This document is incomplete without reference to, and should be assessed solely in conjunction with, the oral briefing provided by Barclays. Neither Barclays nor any of its subsidiaries or affiliates shall be obliged by having made this document available to you to provide any financial advisory services (whether in relation to the matter or possible transaction to which this document relates or otherwise) or to sell, acquire, place or underwrite any securities or to lend moneys or to provide any other commitment, facility, product, risk management solution or service, nor does Barclays represent by providing this document to the Recipient that it will be possible for Barclays to provide, arrange or undertake any of the aforementioned services, activities, products or solutions. Any commitment by Barclays to provide, arrange or undertake any of the aforementioned services, activities, products or solutions would be subject to Barclays signing appropriate documentation, obtaining all necessary internal approvals and completing due diligence, in each case in a manner satisfactory to Barclays. This document was prepared on the basis of information and data, obtained from publicly available sources and, where applicable, from the Recipient and/or any other entity that may be involved in any transaction or matter contemplated by this document (and/or any of the Recipient’s or the aforementioned entities’ affiliates), in each case prior to or on the date hereof. Barclays makes no warranty or representation, express or implied, as to the accuracy or completeness of information which is contained in this document and which is stated to have been obtained from or is based upon trade and statistical services or other third party sources. The information in this document has not been independently verified by Barclays and Barclays does not assume any liability for any such information. Any data on past performance, modeling or back-testing contained herein is no indication as to future performance. No representation is made as to the reasonableness of the assumptions made within or the accuracy or completeness of any modeling or back-testing or any other information contained herein. All opinions and estimates are given as of the date hereof and are subject to change and Barclays assumes no obligation to update this document to reflect any such changes. The value of any investment may fluctuate as a result of market changes. The information herein is not intended to predict actual results and no assurances are given with respect thereto. Nothing herein shall be deemed to constitute investment, legal, tax, financial, accounting or other advice. The Recipient is responsible for making its own independent investigation and appraisal of the risks, benefits, appropriateness and suitability of any transaction or matter contemplated by this document and Barclays is not making any recommendation (personal or otherwise) or giving any investment advice and will have no liability with respect thereto. The decision to proceed with any transaction or action contemplated by this document must be made by the Recipient in the light of its own commercial assessments and Barclays will not be responsible for such assessments. Neither Barclays nor any of its subsidiaries or affiliates, nor any of their respective directors, officers, employees, advisors or other representatives (Barclays together with such persons being the “Barclays Group”) accepts any liability whatsoever for any direct, indirect or consequential losses (in contract, tort or otherwise) arising from the use of this document or its contents or any reliance on the information contained herein. Barclays Group is not responsible for any specialized advice (including financial, tax, legal and accounting, among other advice). This document does not constitute nor does it form part of an offer to sell or purchase, or the solicitation of an offer to sell or purchase, any securities or any of the businesses or assets described herein or an offer or recommendation to enter into any transaction described herein nor does this document constitute an offer or commitment to provide, arrange or underwrite any financing. Members of the Barclays Group are involved in a wide range of commercial banking, investment banking and other activities out of which conflicting interests or duties may arise. In the ordinary course of its business, the Barclays Group may provide services to any other entity or person whether or not a member of the same group as the Recipient (a “Third Party”), engage in any transaction (whether on its own account, on behalf of any Third Party or otherwise, and including any transaction or matter contemplated by this document), notwithstanding that such services, transactions or actions may be adverse to the Recipient or any member of the Recipient’s group, and the Barclays Group may retain for its own benefit any related remuneration or profit. The Barclays Group operates in accordance with a conflicts of interest policy which identifies conflicts of interest it faces in the ordinary course of its business, and establishes organisational and procedural measures to manage those conflicts where it is reasonably able to do so. Neither Barclays nor any other part of the Barclays Group shall have any duty to disclose to the Recipient or utilise for the Recipient’s benefit any non-public information acquired in the course of providing services to any other person, engaging in any transaction (on its own account or otherwise) or otherwise carrying on its business. The Barclays Group’s research analysts and research departments are independent from its banking business and are subject to certain regulations and internal policies. The Barclays Group’s research analysts may hold opinions and make statements or investment recommendations and/or publish research reports with respect to any company referred to herein, the transactions contemplated herein or any person or entity involved therein or related thereto that differ from or are inconsistent with the views or advice communicated by the Barclays Group’s banking business. Barclays is a full service securities firm and as such from time to time may effect transactions for its own account or the account of its clients and hold long or short positions in debt, equity or other securities of the companies referred to herein or in other financial products and instruments. Unless otherwise expressly agreed or provided for in other applicable Barclays disclosures governing such transactions or required by law or regulation, Barclays conducts these activities as principal and executes its principal transactions as an arm’s length counterparty. Barclays does not act as a fiduciary in relation to these transactions. THIS DOCUMENT DOES NOT DISCLOSE ALL THE RISKS AND OTHER SIGNIFICANT ISSUES RELATED TO AN INVESTMENT IN THE SECURITIES, FINANCIAL INSTRUMENTS OR TRANSACTIONS DESCRIBED HEREIN. PRIOR TO TRANSACTING, YOU SHOULD ENSURE THAT YOU FULLY UNDERSTAND THE TERMS OF THE TRANSACTION AND ANY APPLICABLE RISKS. The information contained herein is not intended to be distributed to any prospective or actual investors and, accordingly, may not be shown or given to any person other than the recipient, and is not to be forwarded to any other person (including any retail investor or customer), copied or otherwise reproduced or distributed to any such person in any manner whatsoever. FAILURE TO COMPLY WITH THIS DIRECTIVE CAN RESULT IN A VIOLATION OF THE SECURITIES ACT OF 1933, AS AMENDED. These materials have not been produced by the Barclays Group’s research department and do not constitute investment research or a research recommendation for the purposes of the Financial Conduct Authority rules or a research report under applicable U.S. law. Barclays Capital Inc. is the United States investment bank of Barclays Bank PLC. Barclays Bank PLC is authorised by the Prudential Regulation Authority and regulated by the Financial Conduct Authority and the Prudential Regulation Authority (Financial Services Register No. 122702). Registered in England. Registered No. 1026167. Registered office: 1 Churchill Place, London E14 5HP. Copyright Barclays Bank PLC, 2023 (all rights reserved). 4
Exhibit (f)(2)
Delaware Revised Uniform Limited Partnership Act
Delaware Code Title 6 § 17-212:
Unless otherwise provided in a partnership agreement or an agreement of merger or consolidation or a plan of merger or a plan of division, no appraisal rights shall be available with respect to a partnership interest or another interest in a limited partnership, including in connection with any amendment of a partnership agreement, any merger or consolidation in which the limited partnership or a registered series of the limited partnership is a constituent party to the merger or consolidation, any division of the limited partnership, any conversion of the limited partnership to another business form, any conversion of a protected series of the limited partnership to a registered series of such limited partnership, any conversion of a registered series of the limited partnership to a protected series of such limited partnership, any transfer to or domestication or continuance in any jurisdiction by the limited partnership, or the sale of all or substantially all of the limited partnership’s assets. The Court of Chancery shall have jurisdiction to hear and determine any matter relating to any appraisal rights provided in a partnership agreement or an agreement of merger or consolidation or a plan of merger or a plan of division.
Exhibit 107
CALCULATION OF FILING FEE TABLES
Table 1: Transaction Valuation
| Proposed Maximum Aggregate Value of Transaction |
Fee rate |
Amount of Filing Fee | ||||
|
Fees to Be Paid |
$3,794,537,385.25(1) | 0.00011020 | $418,158.02(2) | |||
|
Fees Previously Paid |
$0 | $0 | ||||
|
Total Transaction Valuation |
$3,794,537,385.25 | |||||
|
Total Fees Due for Filing |
$418,158.02 | |||||
|
Total Fees Previously Paid |
$0 | |||||
|
Total Fee Offsets |
$418,158.02(3) | |||||
|
Net Fee Due |
$0 |
Table 2: Fee Offset Claims and Sources
| Registrant or Filer Name |
Form or Filing Type |
File Number | Initial Filing Date |
Filing Date |
Fee Offset Claimed |
Fee Paid with Fee Offset Source | ||||||||
| Fee Offset Claims |
PREM14C | 001-32678 | March 22, 2023 | $418,158.02 | ||||||||||
|
Fee Offset Sources |
DCP Midstream, LP | PREM14C | 001-32678 | March 22, 2023 | $418,158.02(3) | |||||||||
| (1) | Calculated solely for the purpose of determining the filing fee in accordance with Rule 0-11(b)(1) under the Securities Exchange Act of 1934, as amended (the “Exchange Act”). The transaction valuation (the “Transaction Valuation”) is calculated based on the product of 90,887,123 common units (“Common Units”) representing limited partner interests in DCP Midstream, LP held by the public unitholders (calculated based on 208,649,649 total outstanding Common Units less the sum of 50,874,908 Common Units held by DCP Midstream, LLC and 66,887,618 Common Units held by DCP Midstream GP, LP) multiplied by the per Common Unit merger consideration of $41.75. |
| (2) | The filing fee, calculated in accordance with Rule 0-11 of the Exchange Act, is calculated by multiplying the Transaction Valuation by 0.00011020. |
| (3) | DCP Midstream, LP previously paid $418,158.02 upon the filing of its Information Statement on Schedule 14C on March 22, 2023 in connection with the transaction reported hereby. |